
 Facebook
 X
X
 Pinterest
 Copy Link
Local Market Update – April 2021
Despite a bump in new listings the supply of homes still can’t keep up with the demand. The result? Multiple offers, escalation clauses, and record-breaking prices. If you’re considering selling your home, you’d be hard pressed to find a more lucrative market than what we have today.
March marked the first post-COVID/pre-COVID comparison, and the results were dramatic.
The drop in the number of listings was profound. In King County there were 54% fewer single-family homes on the market at the end of March than the same time a year ago. The Eastside had 68% fewer listings. There were just 216 homes for sale on the Eastside, which stretches from Issaquah to Woodinville. Extensive new investments there, including Amazon’s plan to add 25,000 jobs in Bellevue, will only increase demand for housing. North King County, which includes Richmond Beach and Lake Forest Park had just 26 homes for sale. In Seattle, the 498 listings there represents a drop of 18% from a year ago. Despite the comparatively greater number of listings, Seattle still has only two weeks of available inventory. The situation was even more dire in Snohomish County. With the number of homes for sale down 68%, the county has just one week of inventory.
So why is inventory so low? The pandemic certainly has played a part. People now working from home have bought up properties with more space in more desirable locations. Nervousness and uncertainty about COVID compelled many would-be sellers to postpone putting their home on the market. Downsizers who may have moved into assisted living or nursing homes are staying in place instead. But there are other factors as well.
For more than a decade, less new construction has been built relative to historical averages, particularly in the suburbs. Interest rates have also been a factor. Windermere Chief Economist Matthew Gardner noted, “I think a lot of the urgency from buyers is due to rising mortgage rates and the fear that rates are very unlikely to drop again as we move through the year, which is a safe assumption to make.” Homeowners who refinanced when rates were at record lows are staying in their homes longer, keeping more inventory off the market. And those same low interest rates have compelled many homeowners who bought a new home not to sell their previous one, but to keep it as a rental property.
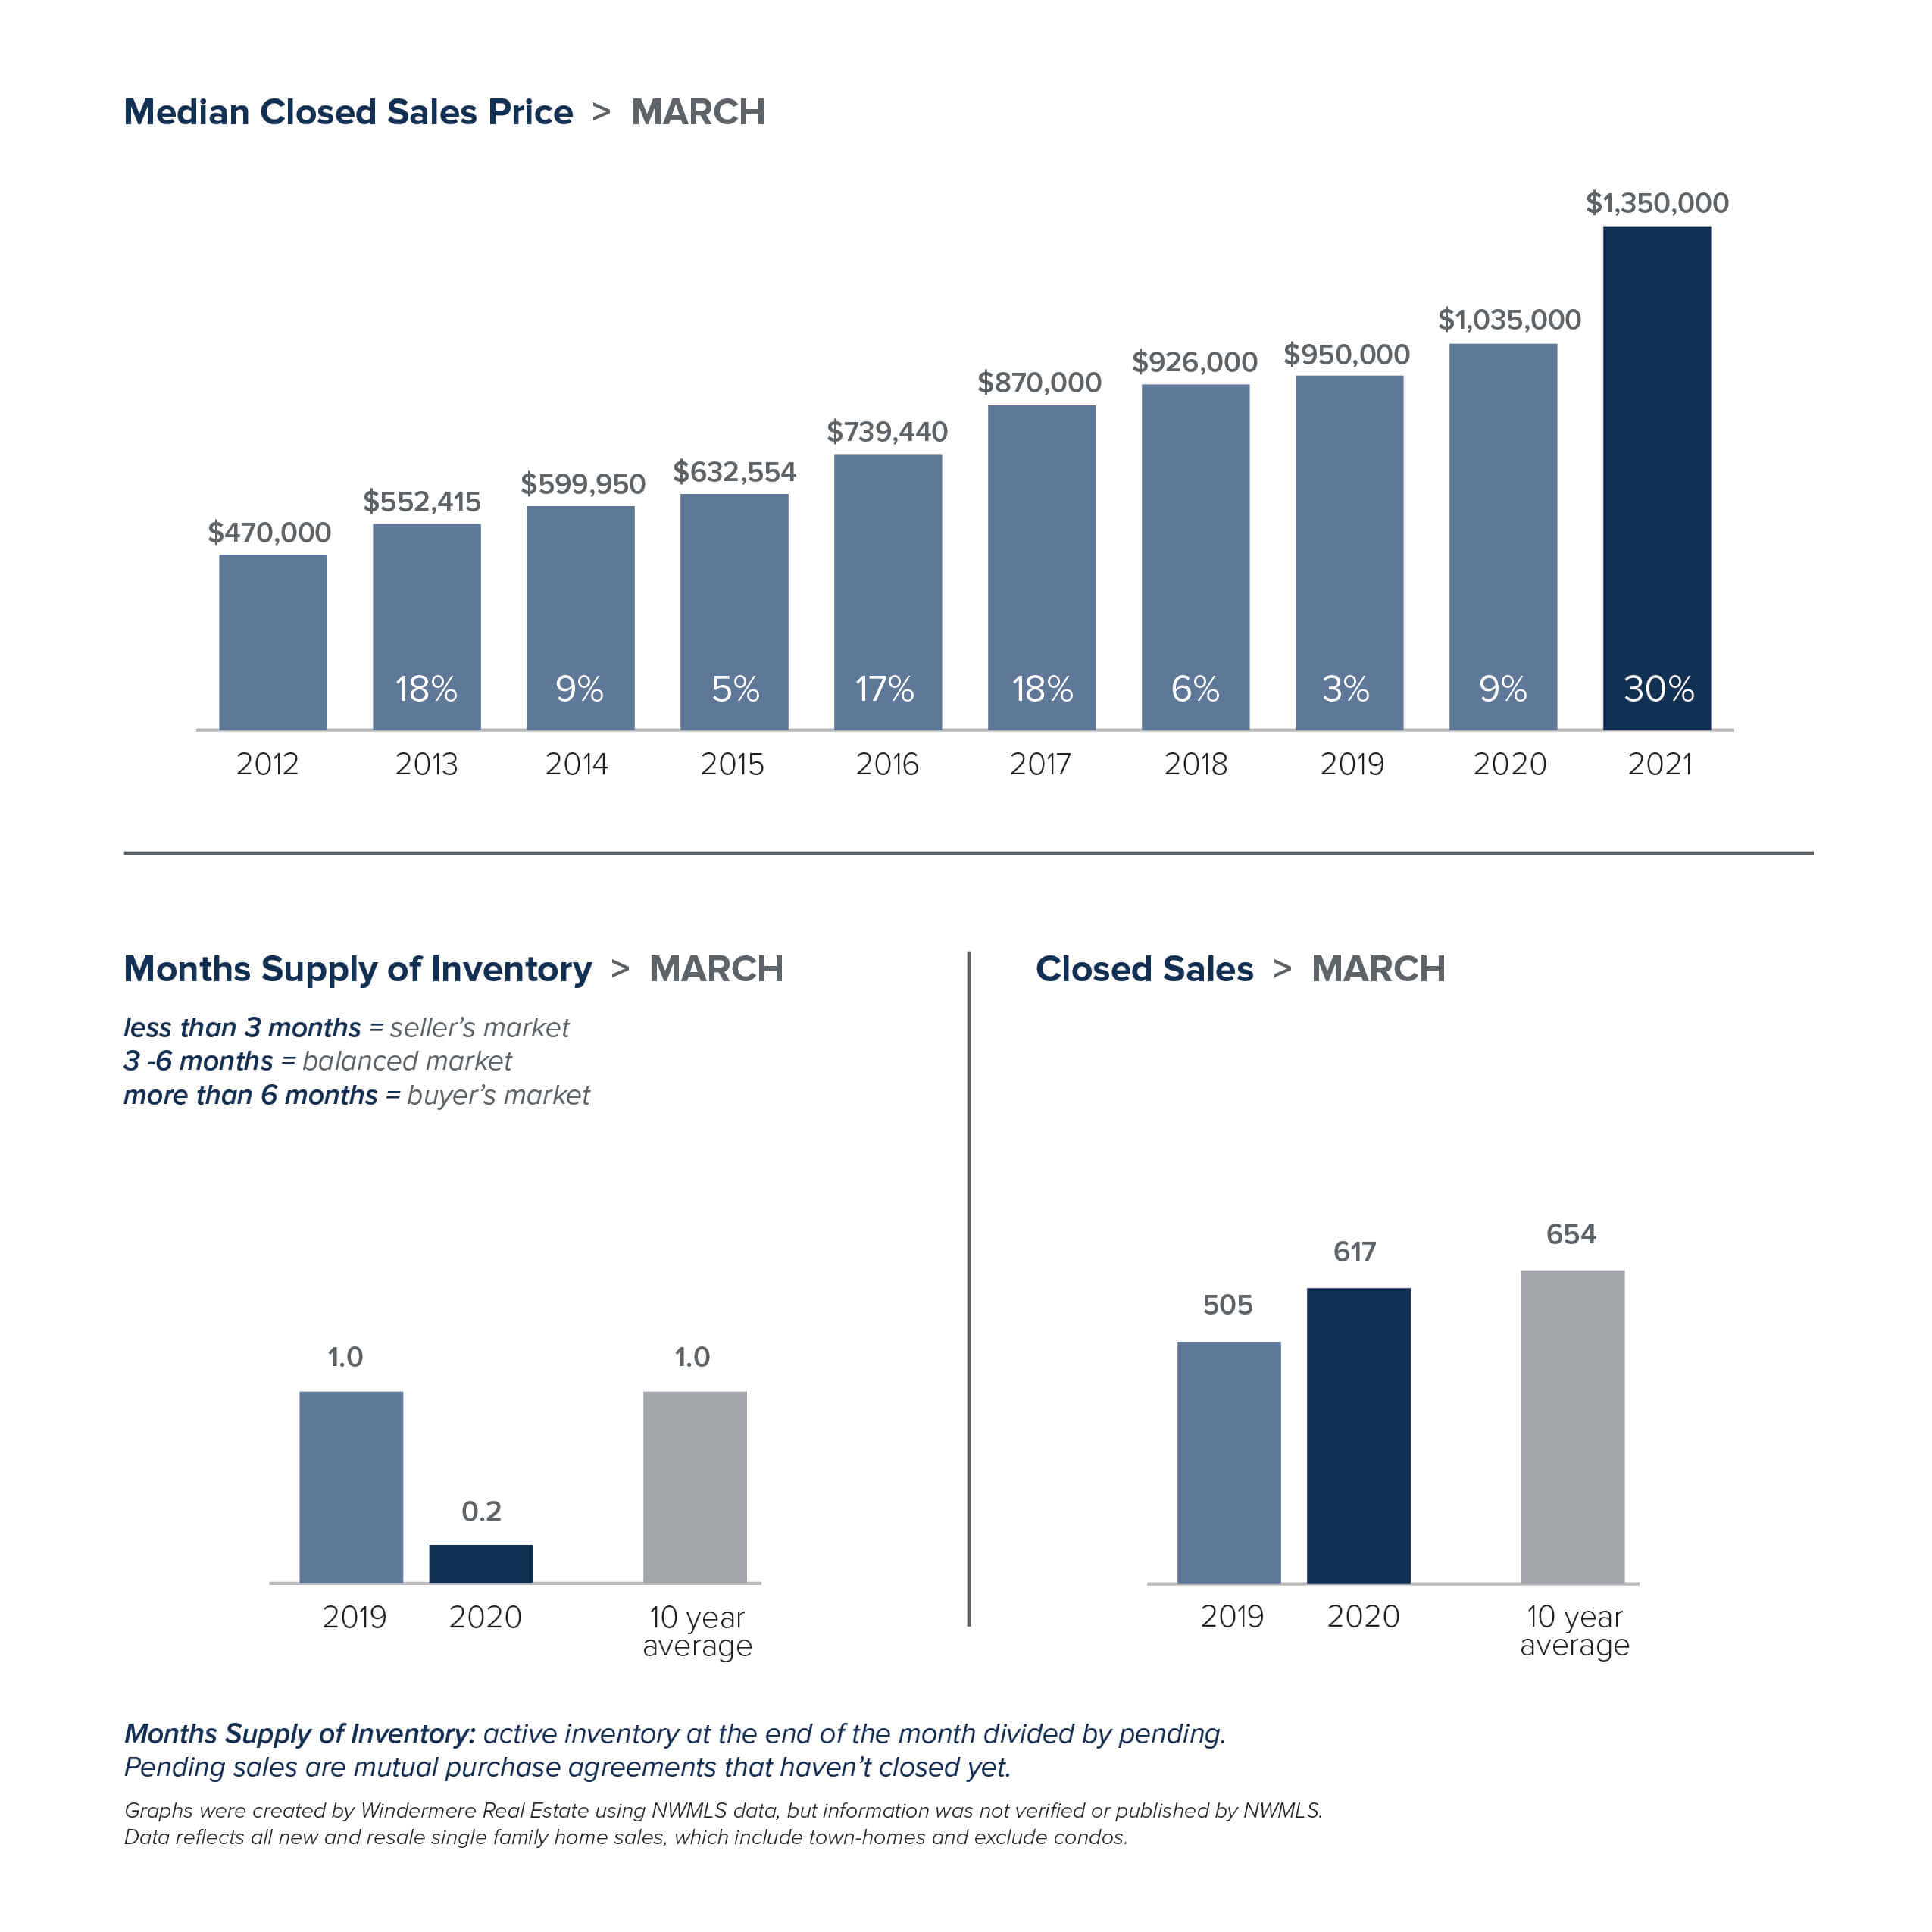
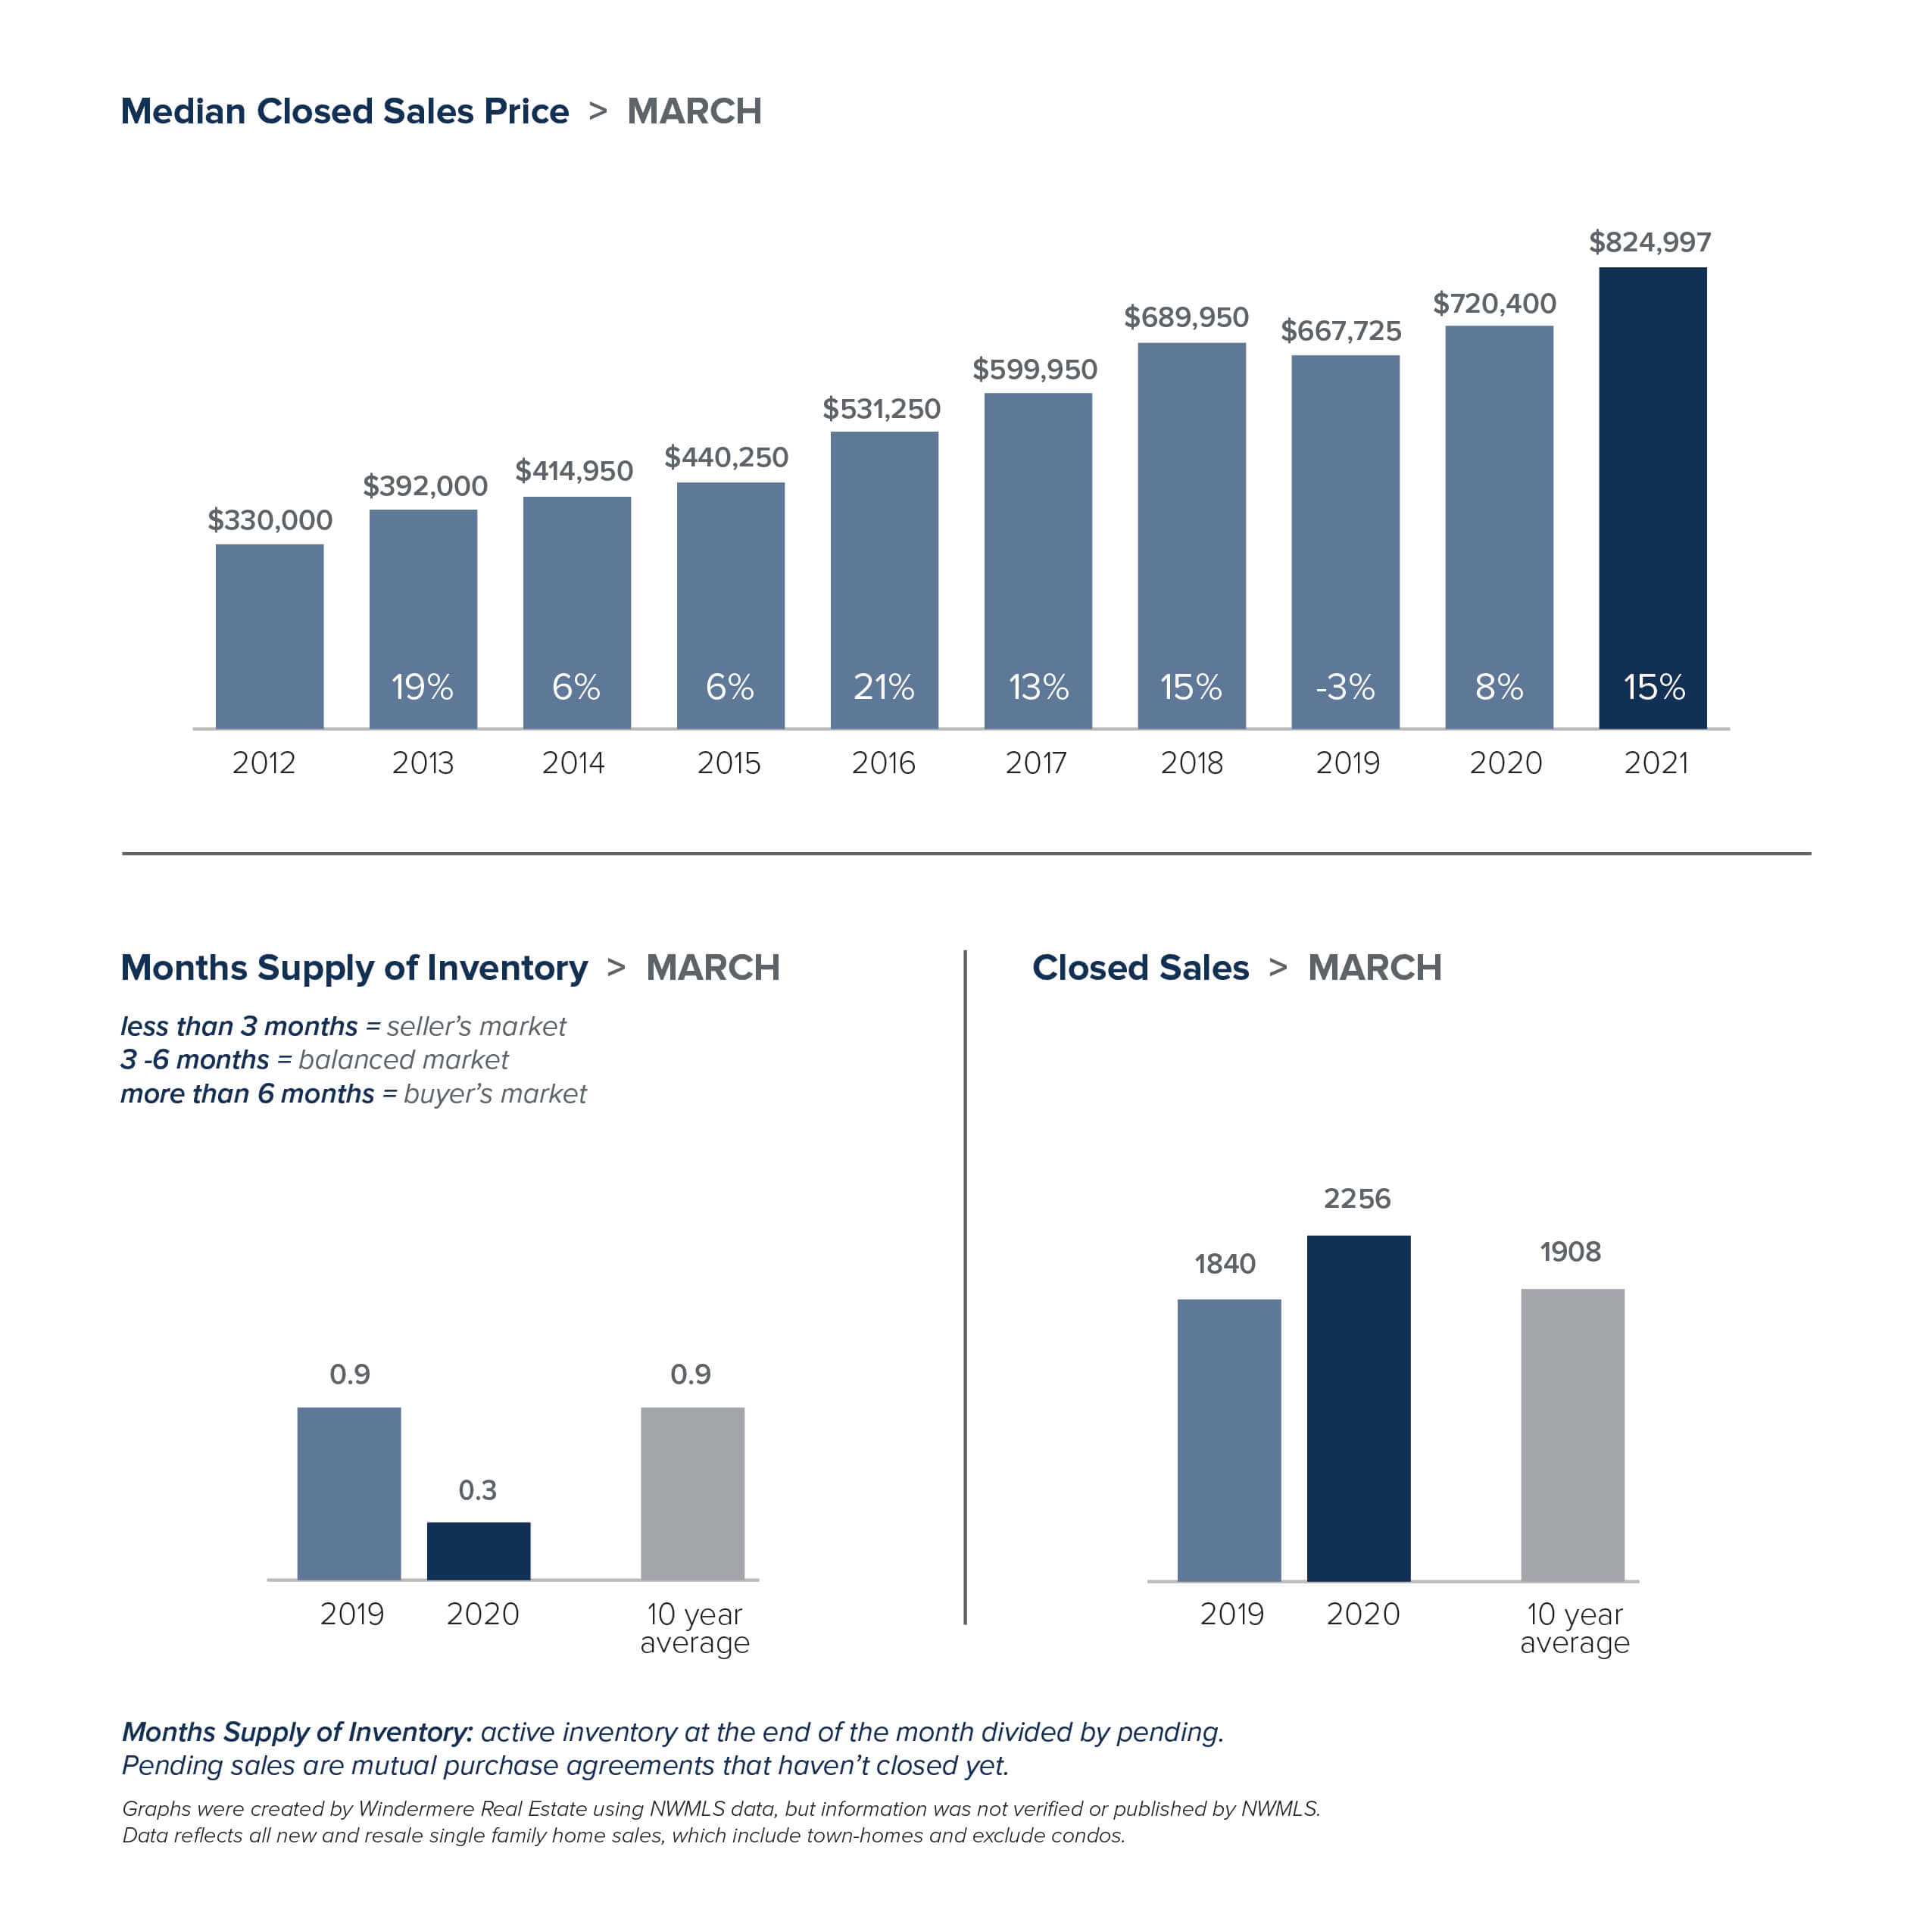
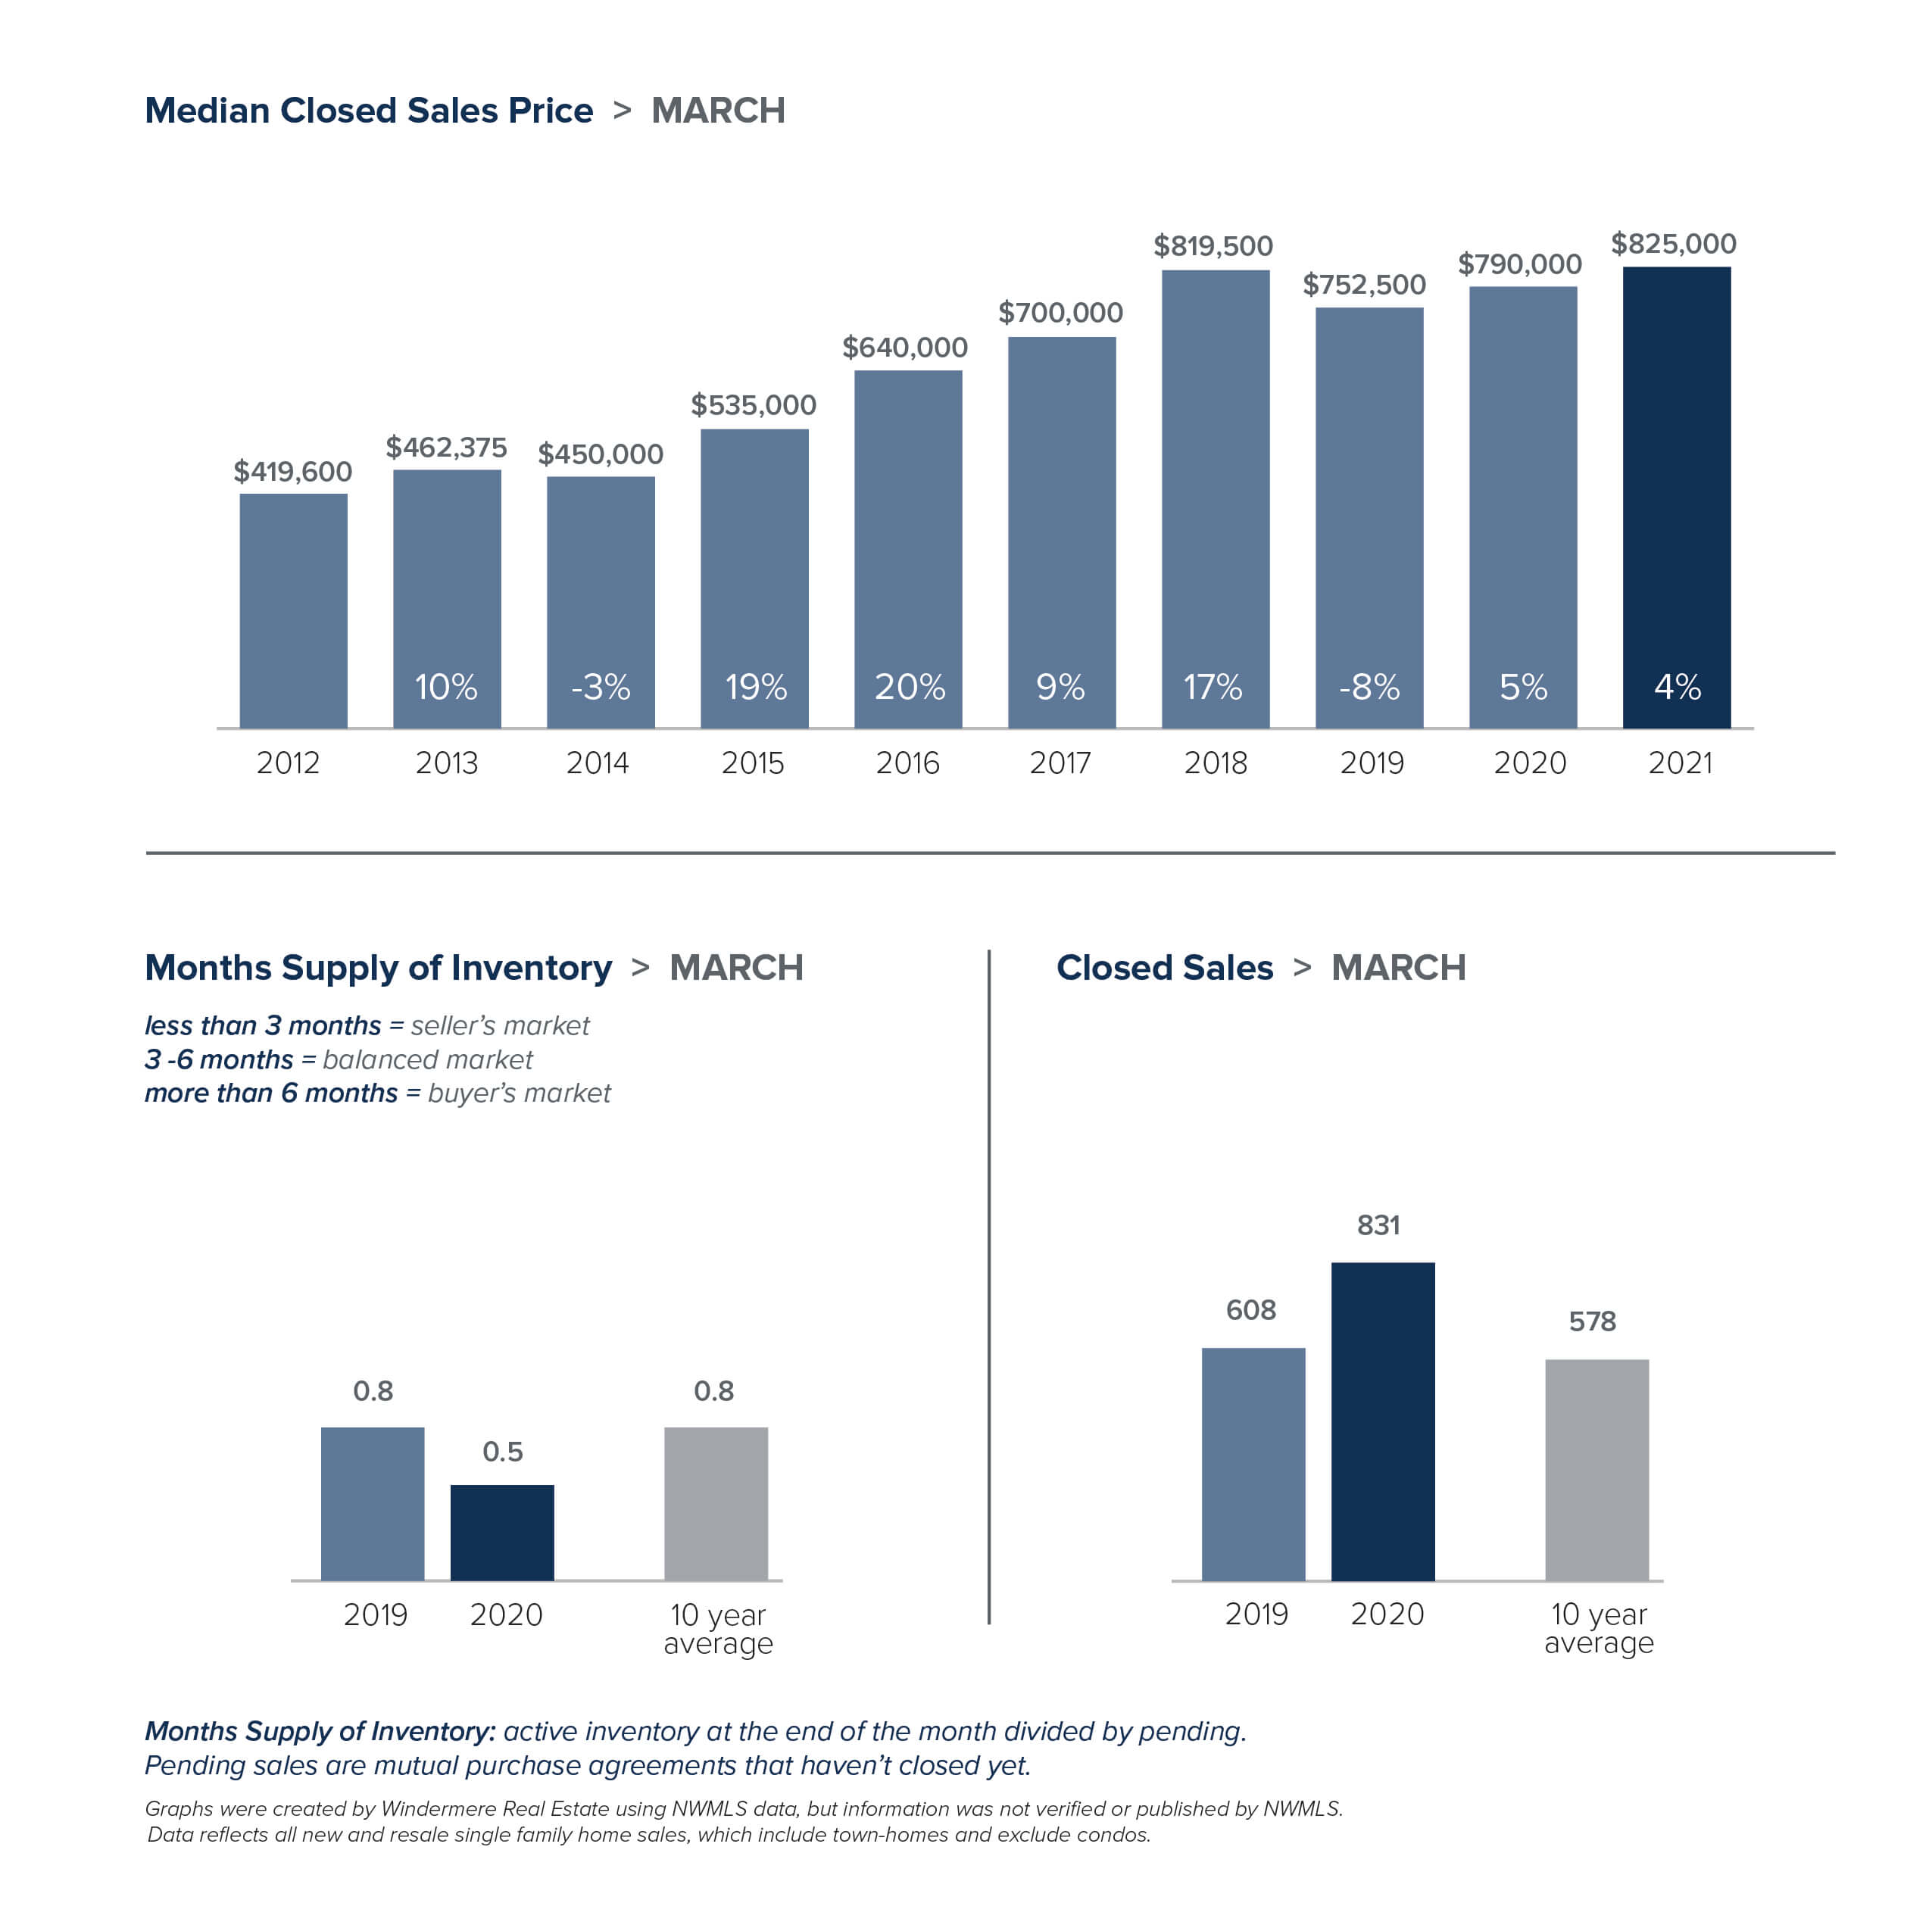
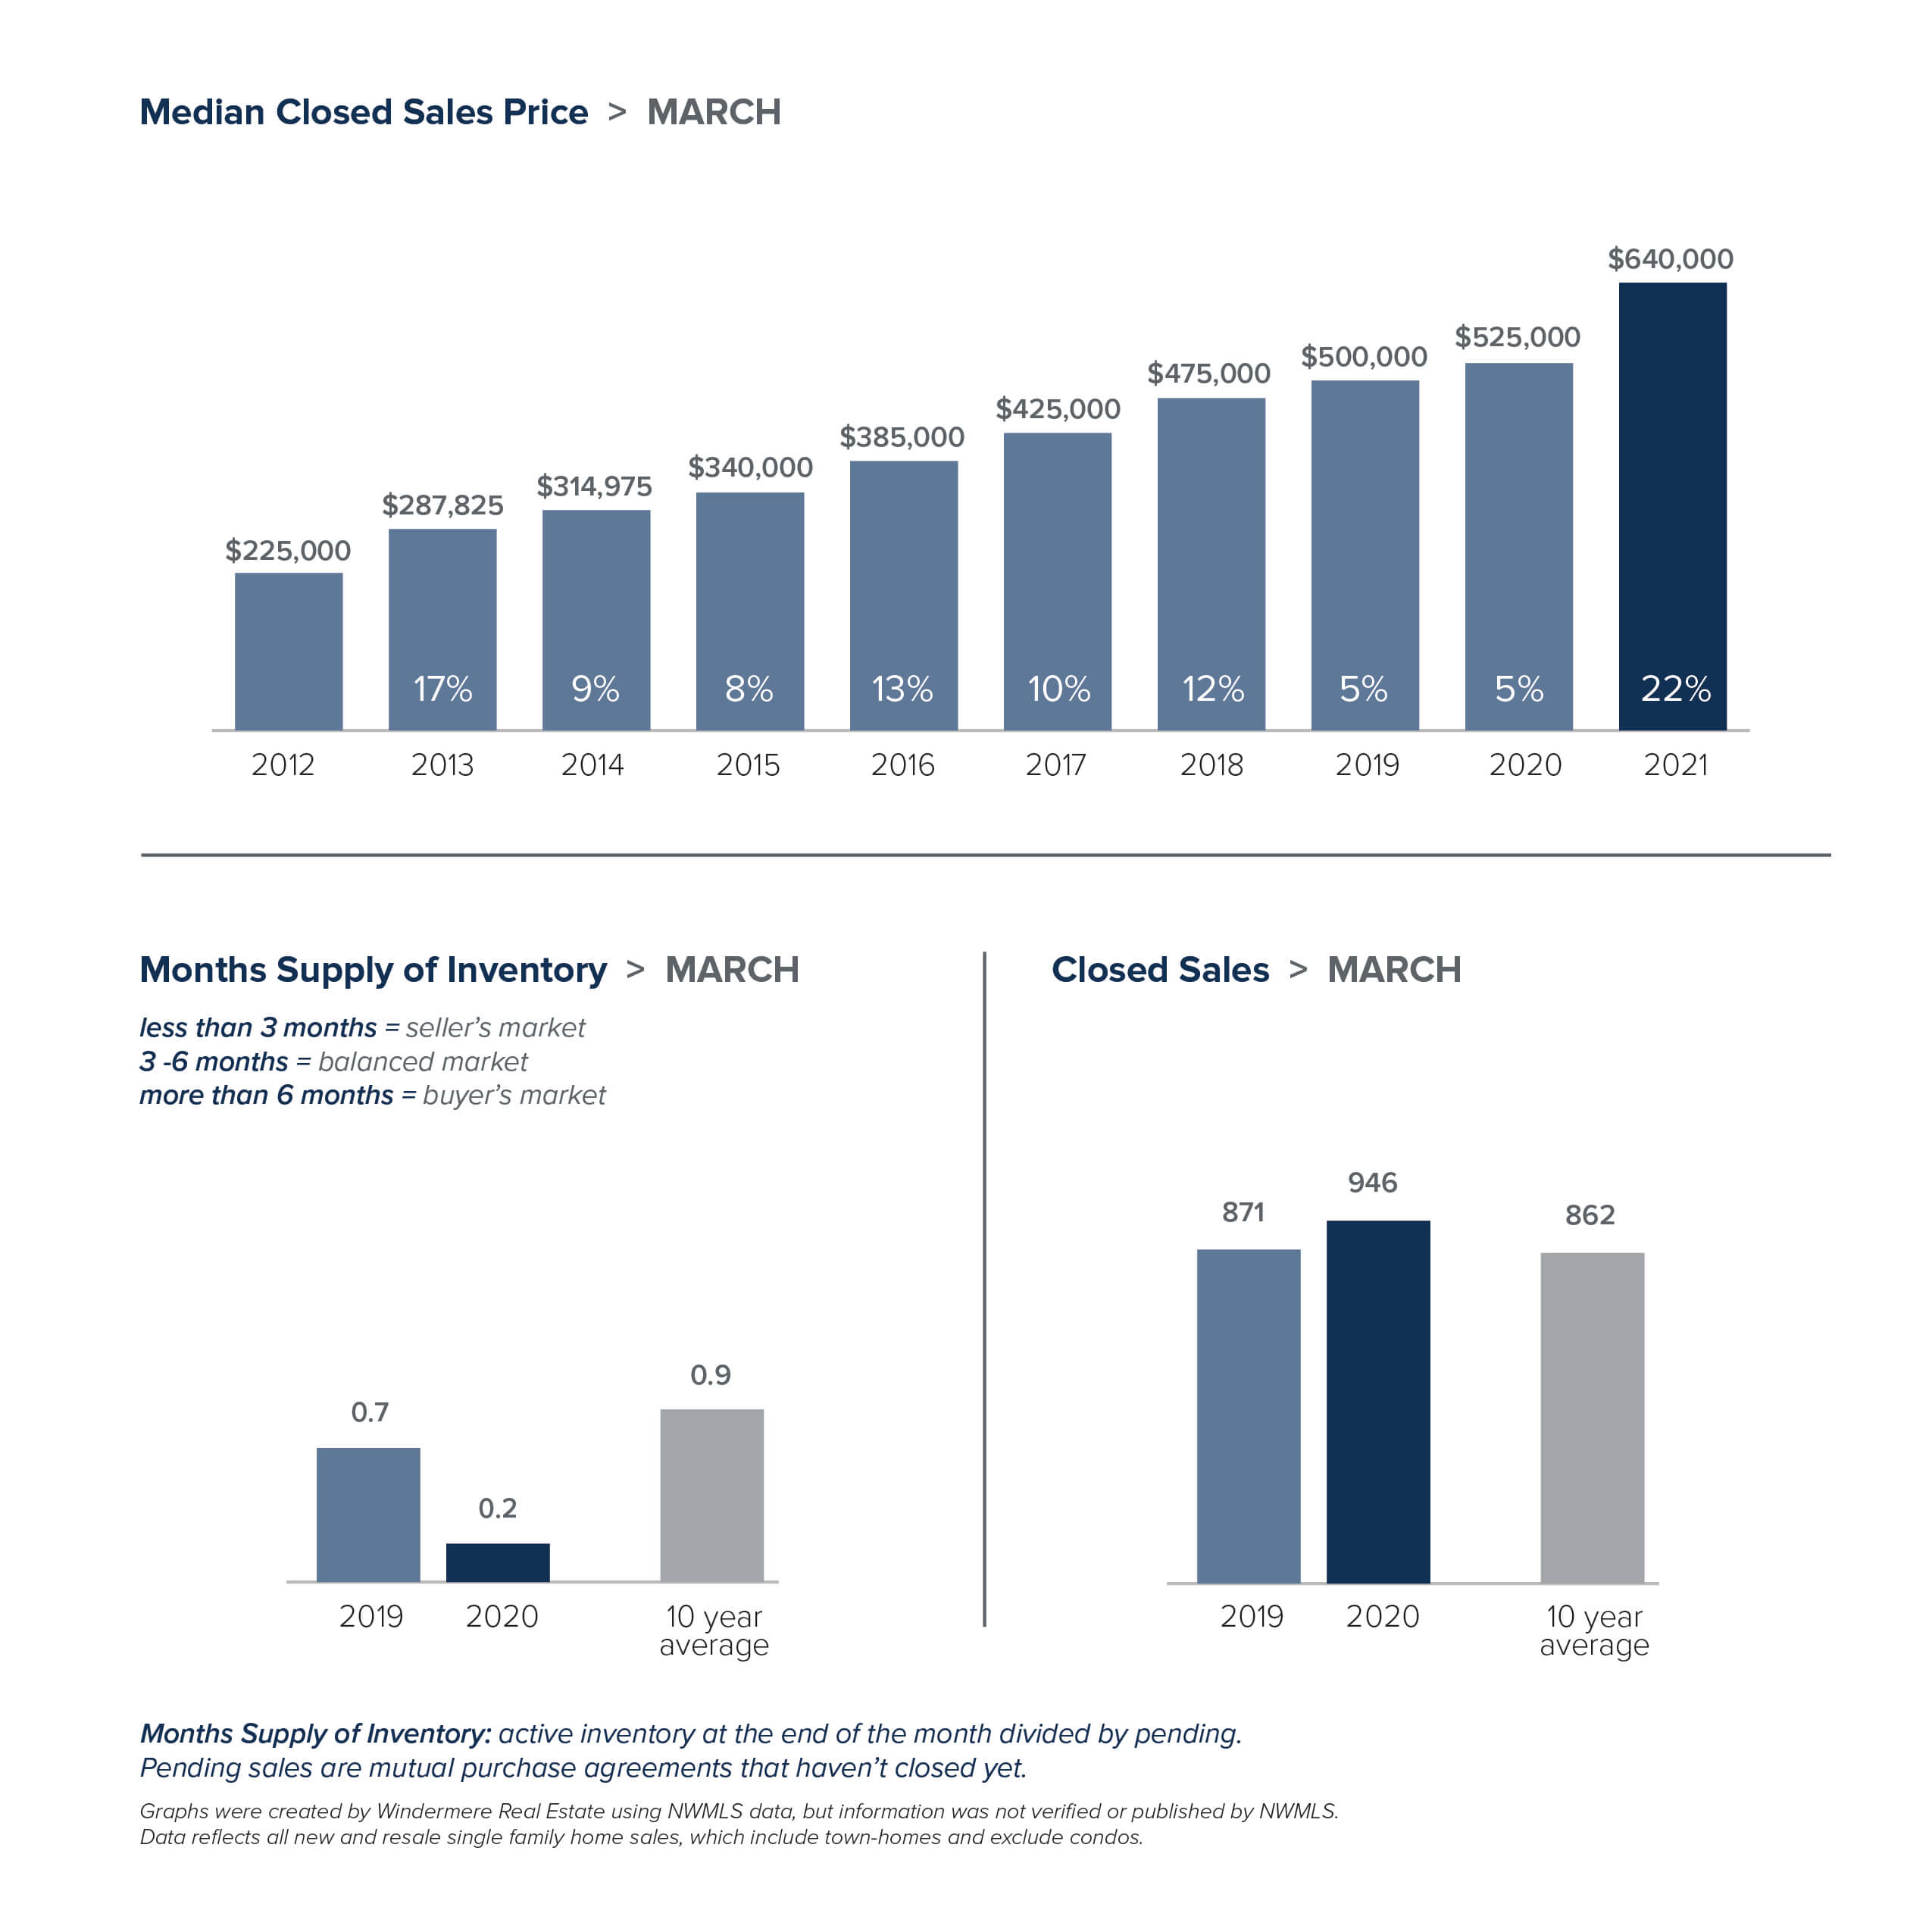
While the number of listings tanked, the number of sales skyrocketed. That’s the recipe for soaring home prices. Housing prices here have been growing at the second-fastest rate in the nation for a full year. Nearly every area of King County saw double-digit price increases, with the exception of Seattle. In King County the median price for a single-family home in March was a record-high $825,000, up 15% from a year ago and an increase of 10% from February. The median home price topped $1 million for every city on the Eastside, where the overall median price surged 30% to $1,350,000, the highest median price ever recorded for the area. Seattle homes prices were also record-breaking, rising 4% to $825,000. Snohomish County prices set yet another all-time high as the median home price jumped 22% to $640,000.
The appeal of our area just keeps growing. For the second time, Washington took the No. 1 spot in the U.S. News Best States ranking – the first state to earn the top ranking twice in a row. The bottom line: the local real estate market is extremely competitive, and it shows no signs of slowing down. Successfully navigating today’s market takes a strong plan. Your broker can work with you to determine the best strategies for your individual situation.
The charts below provide a brief overview of market activity. If you are interested in more information, every Monday Windermere Chief Economist Matthew Gardner provides an update on the US economy and housing market. You can get Matthew’s latest update here.
EASTSIDE
KING COUNTY
SEATTLE
SNOHOMISH COUNTY
VIEW FULL SNOHOMISH COUNTY REPORT
This post originally appeared on
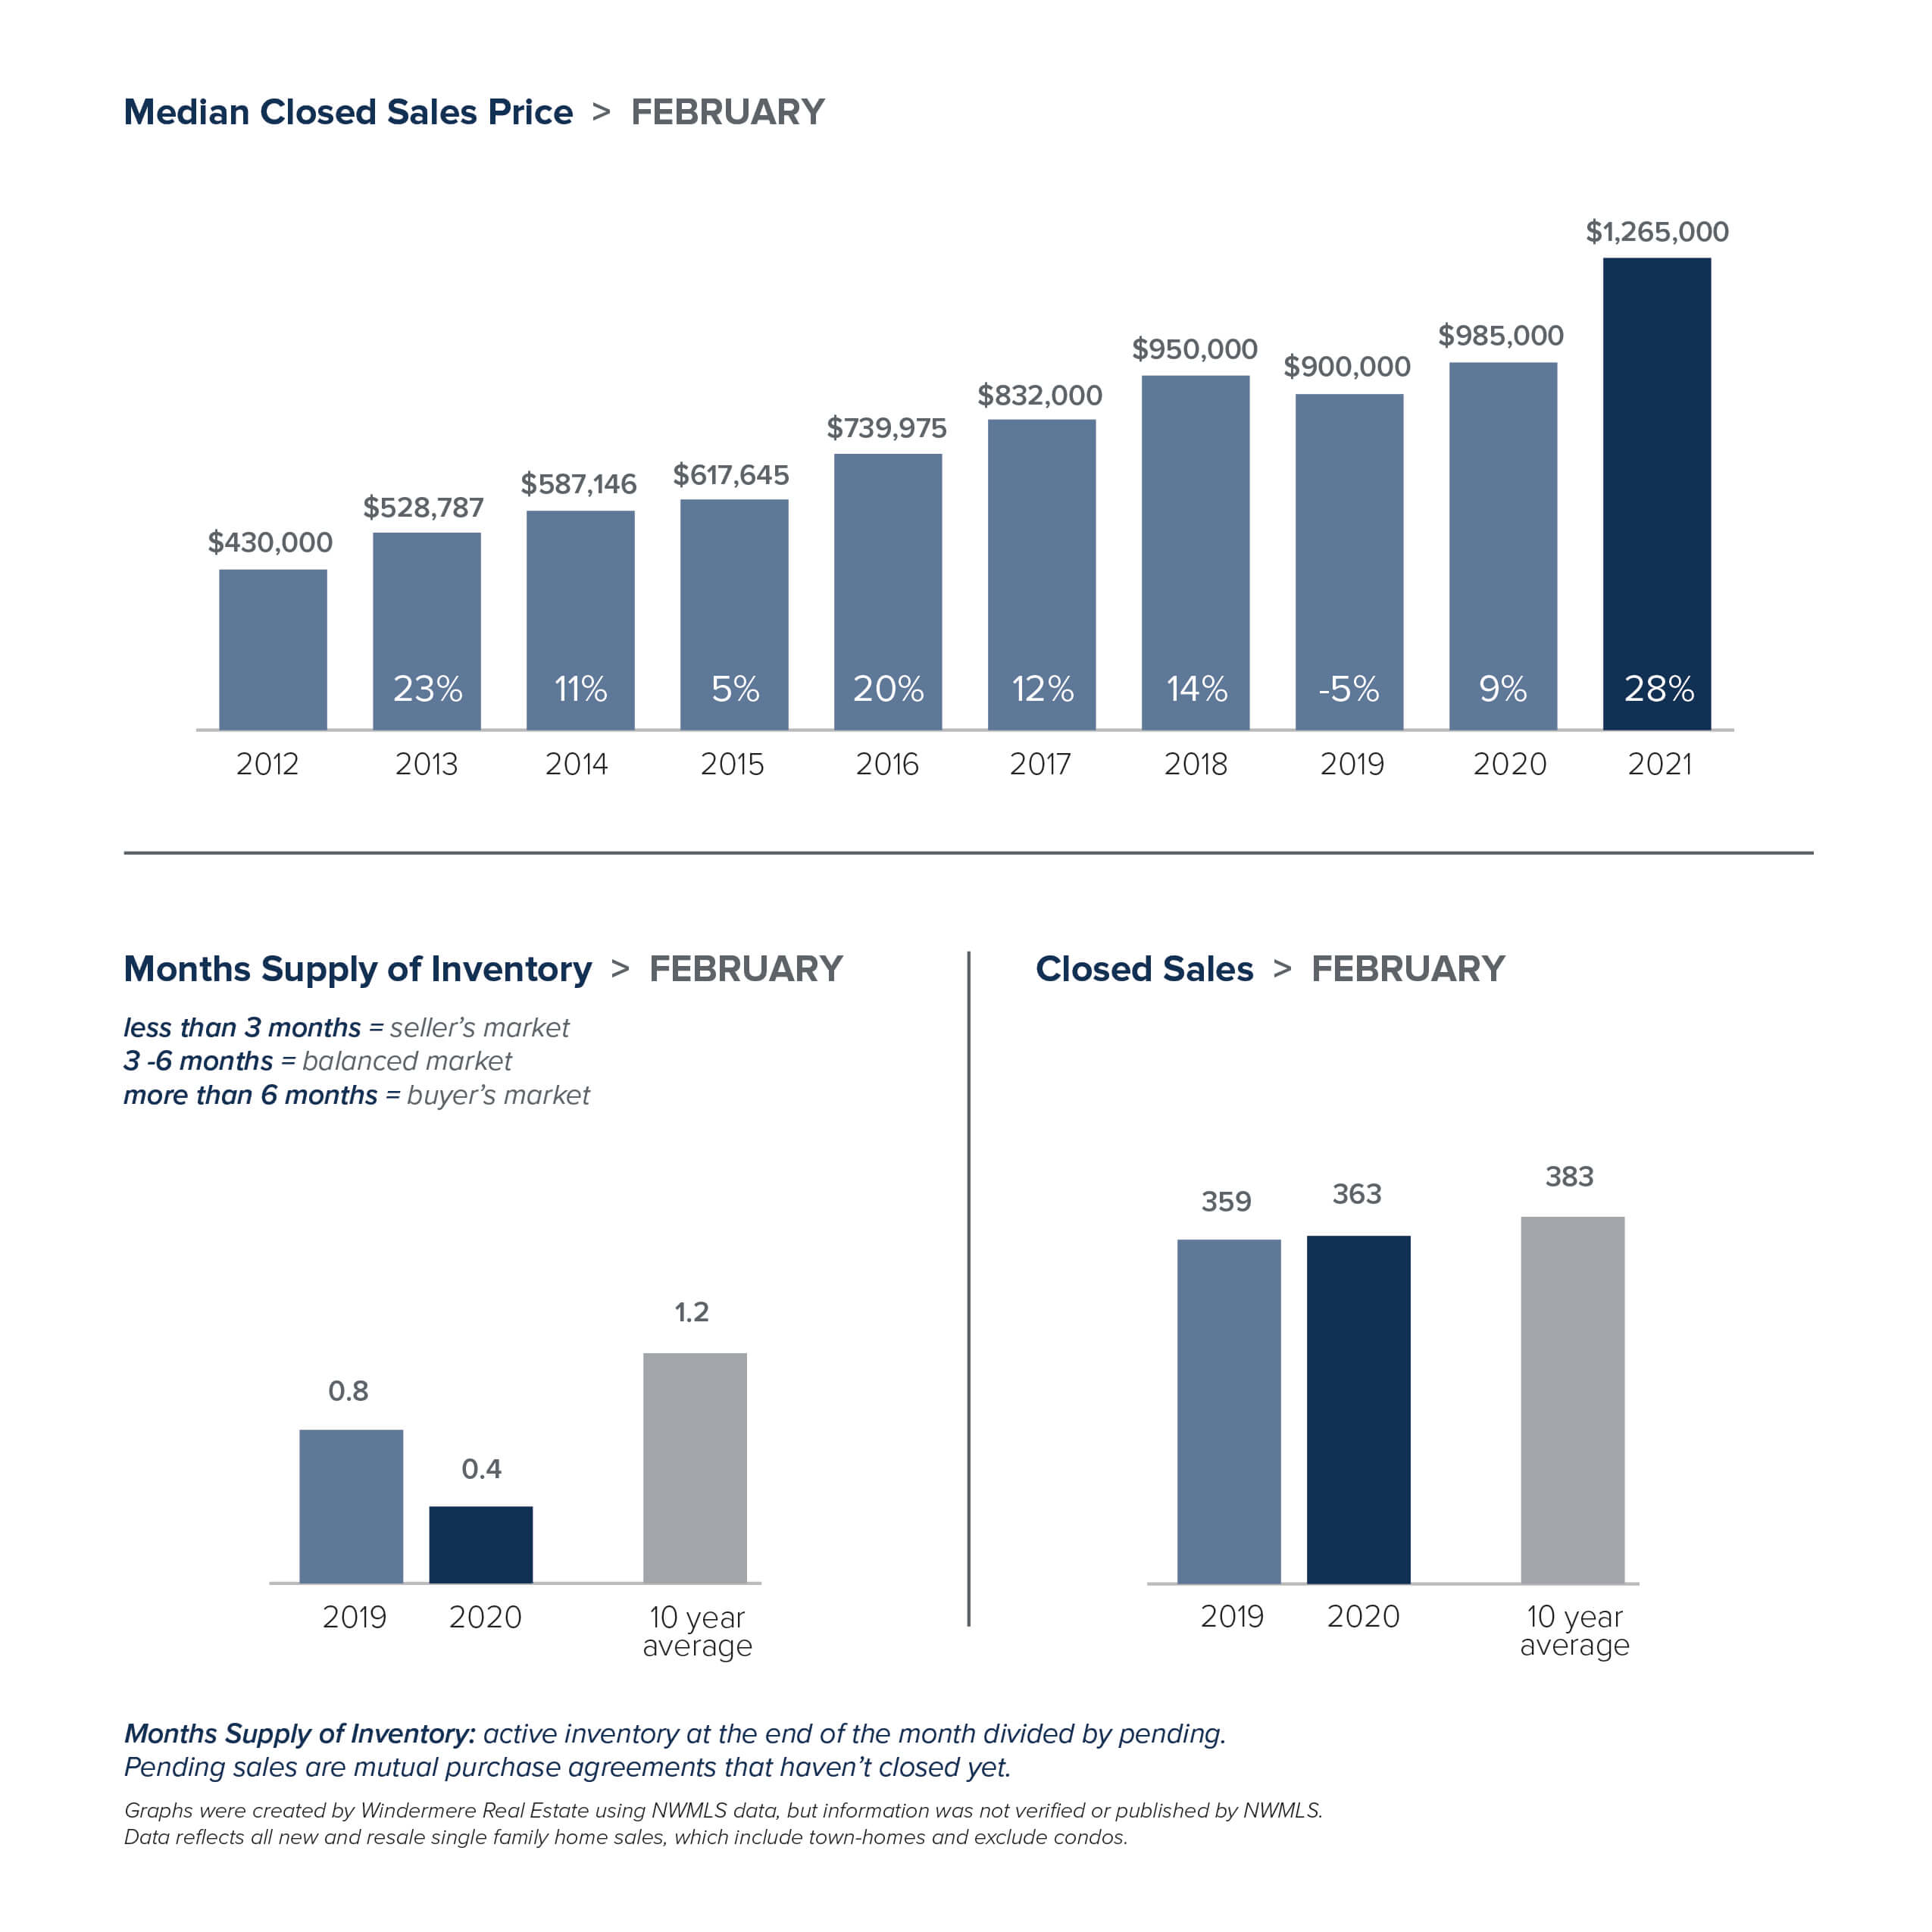
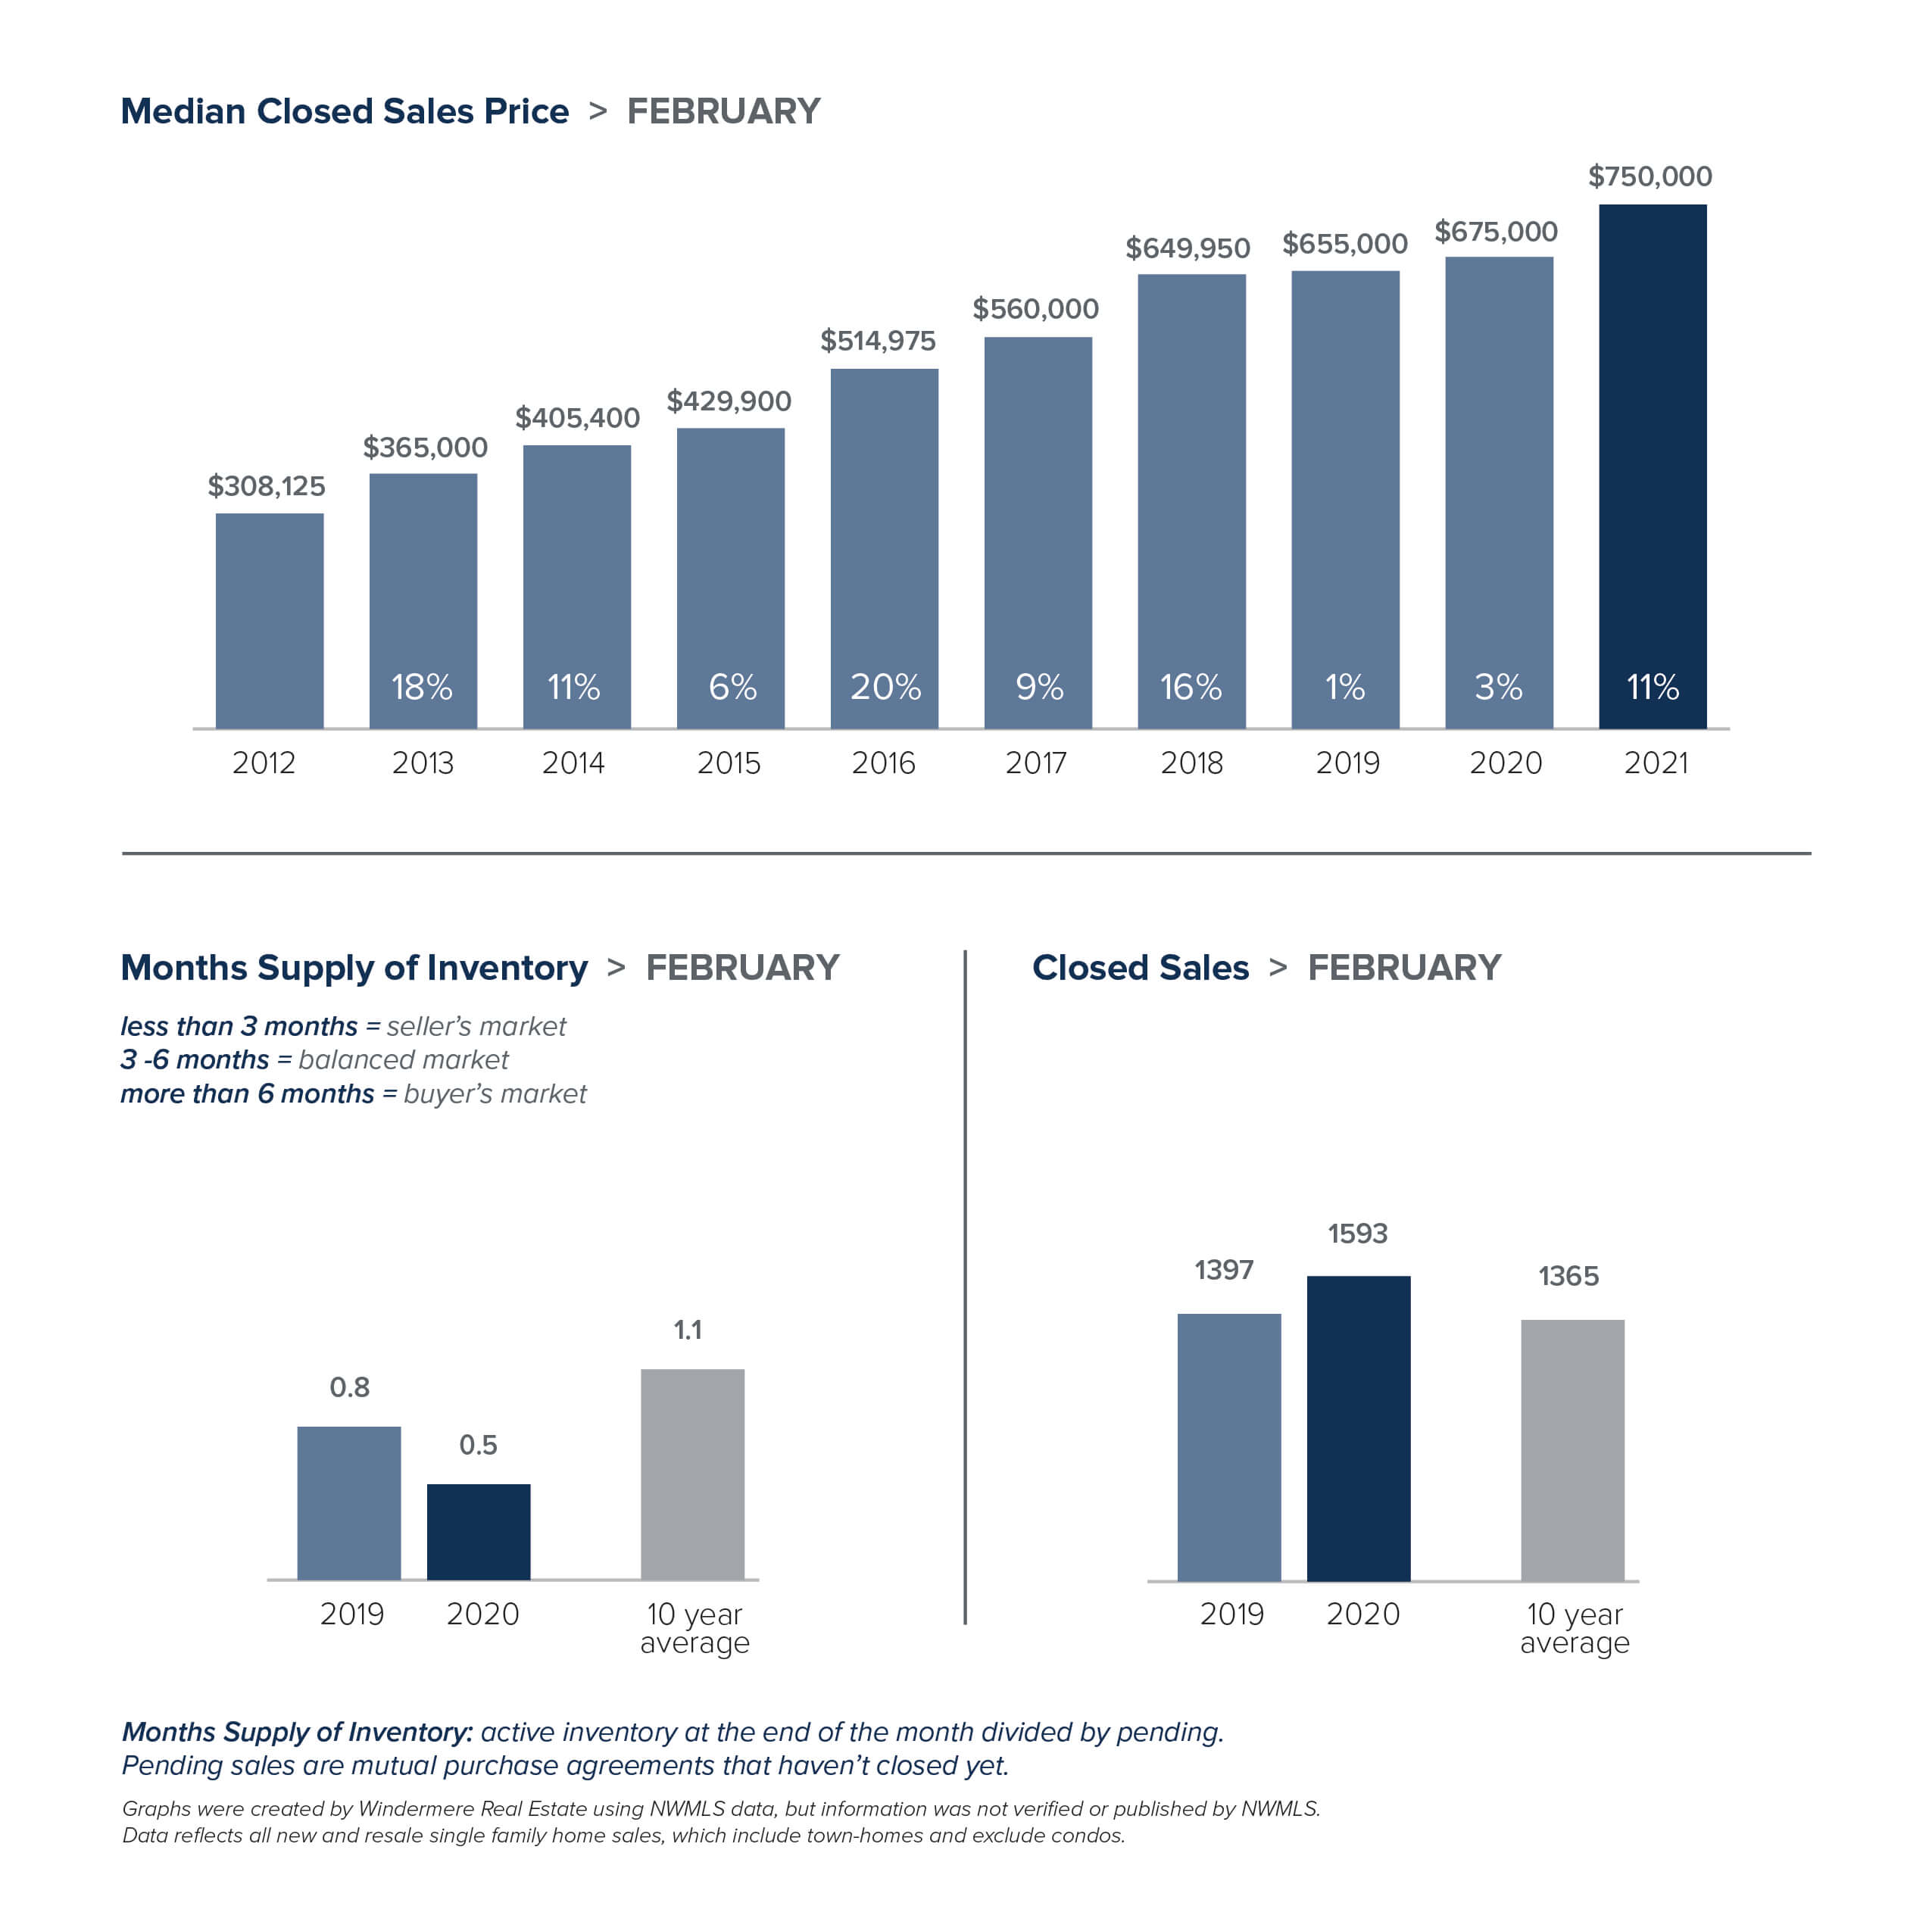
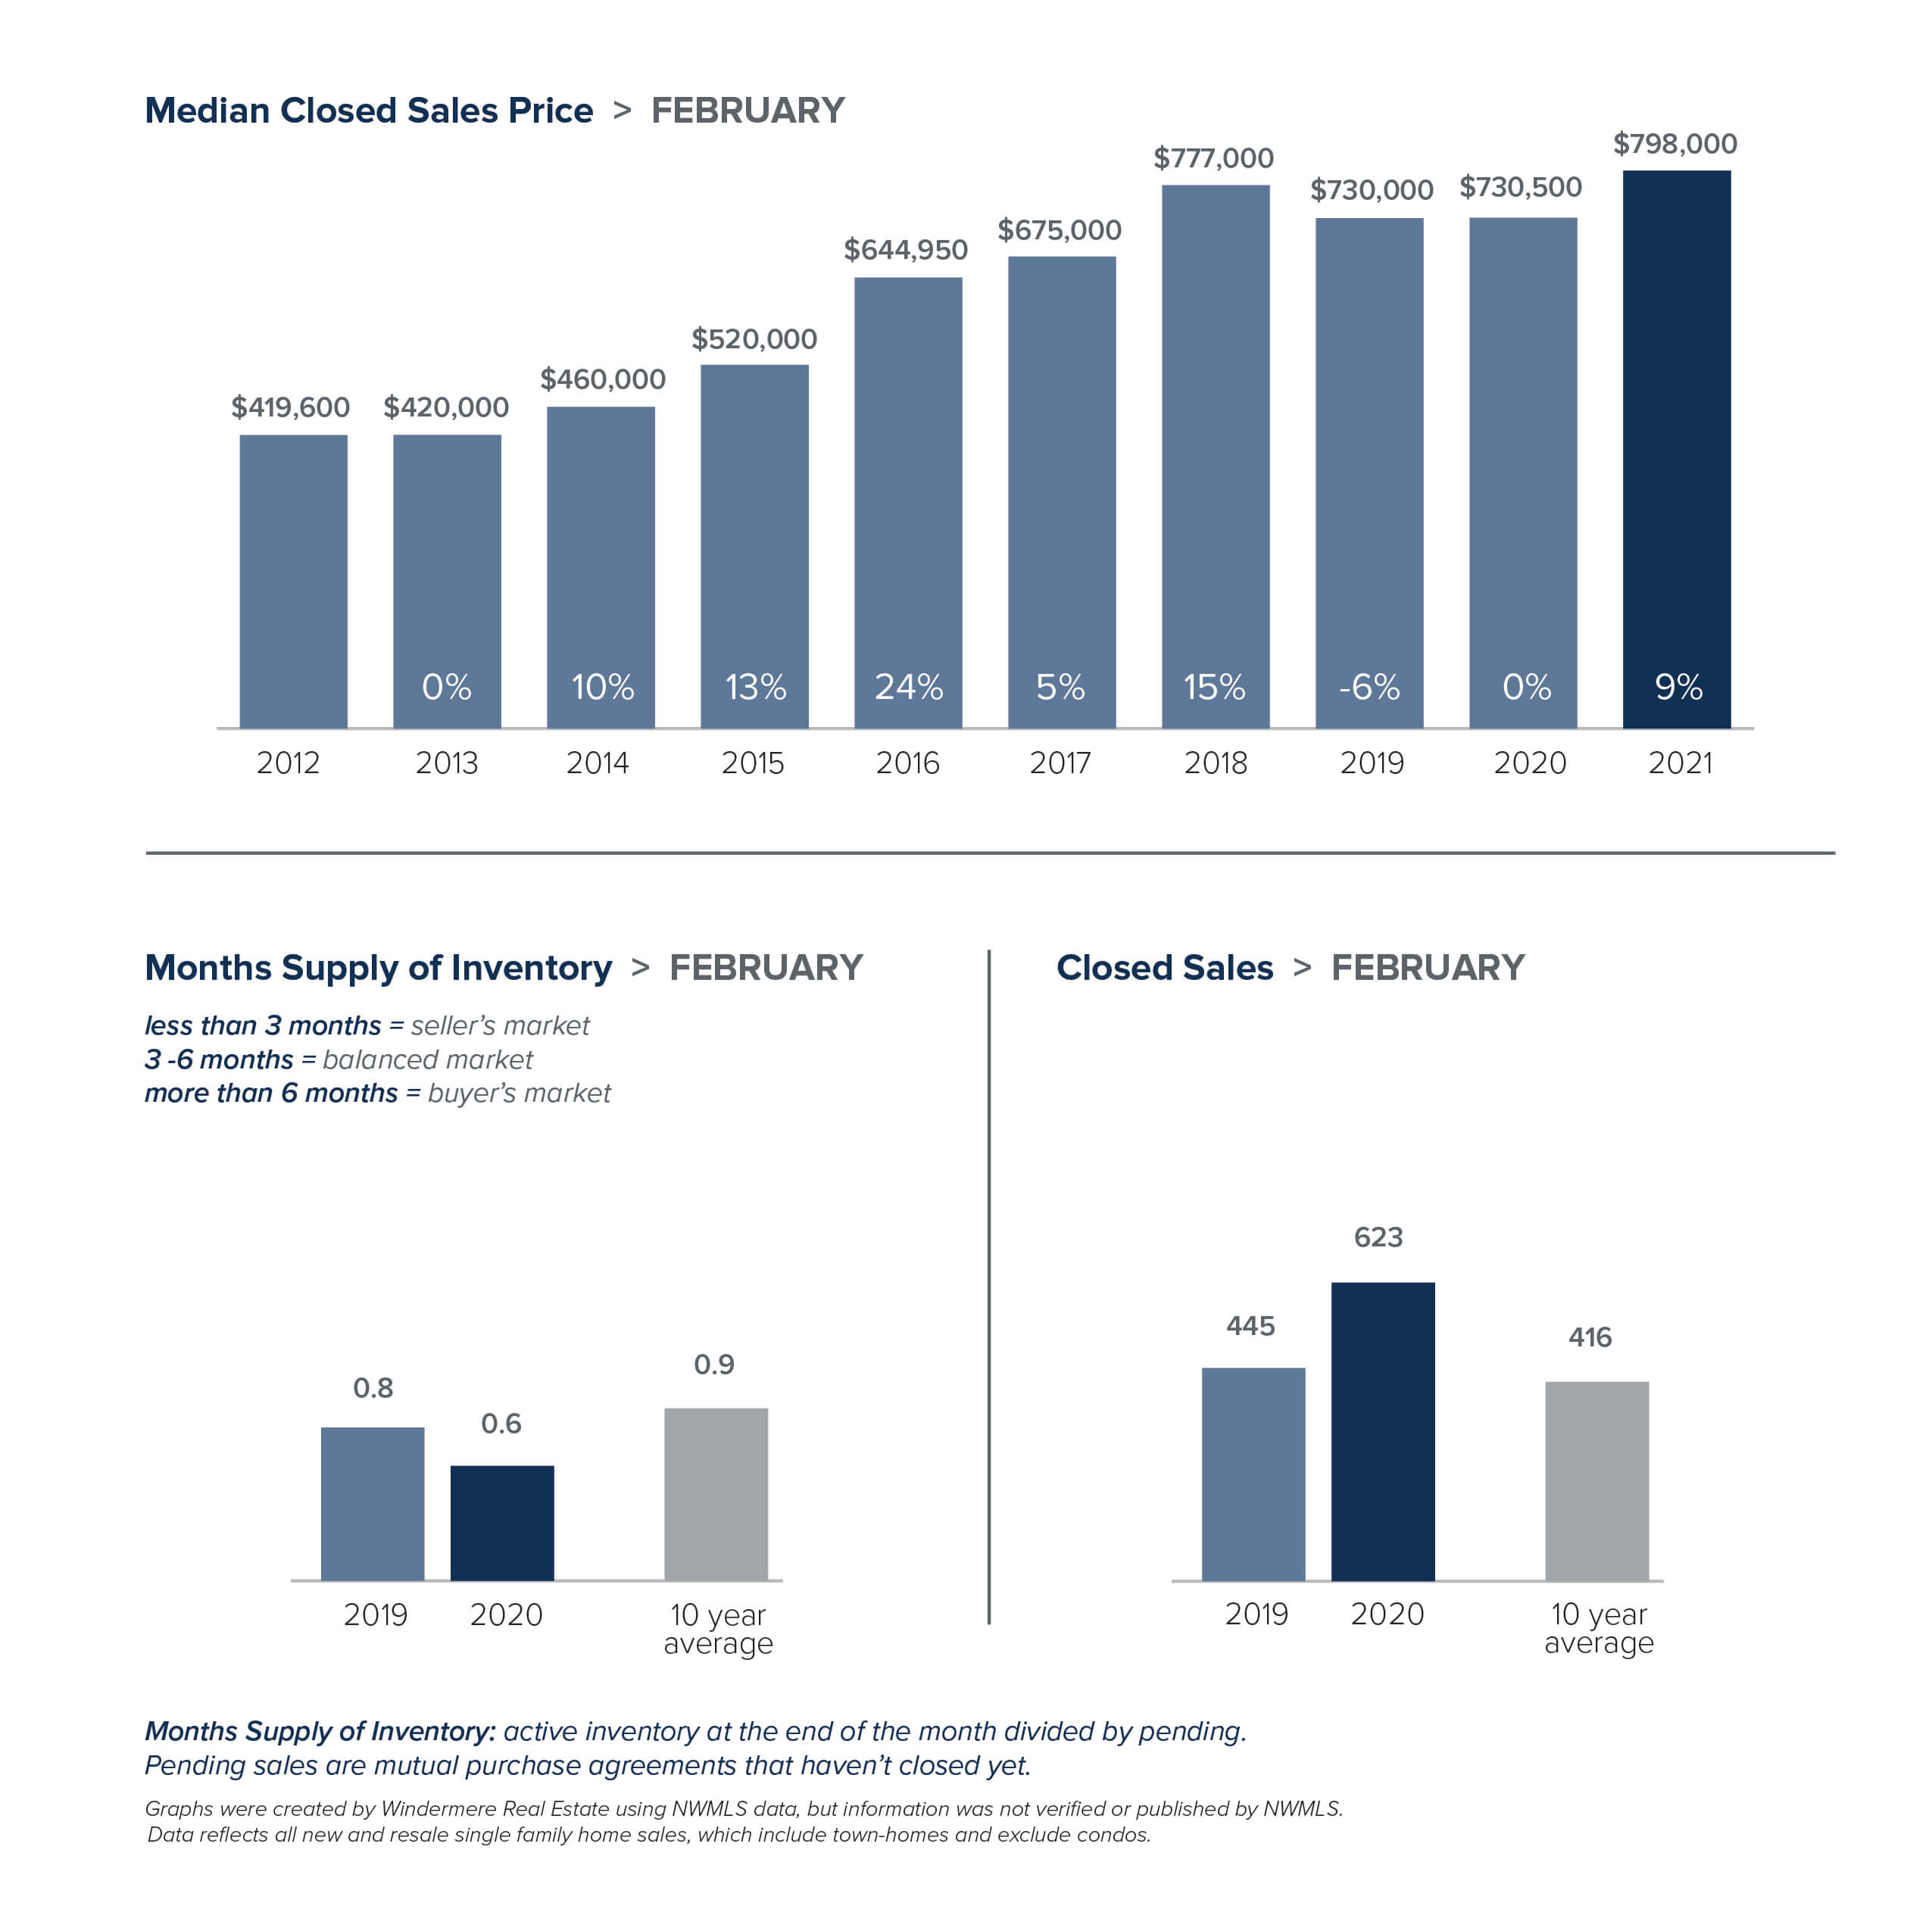
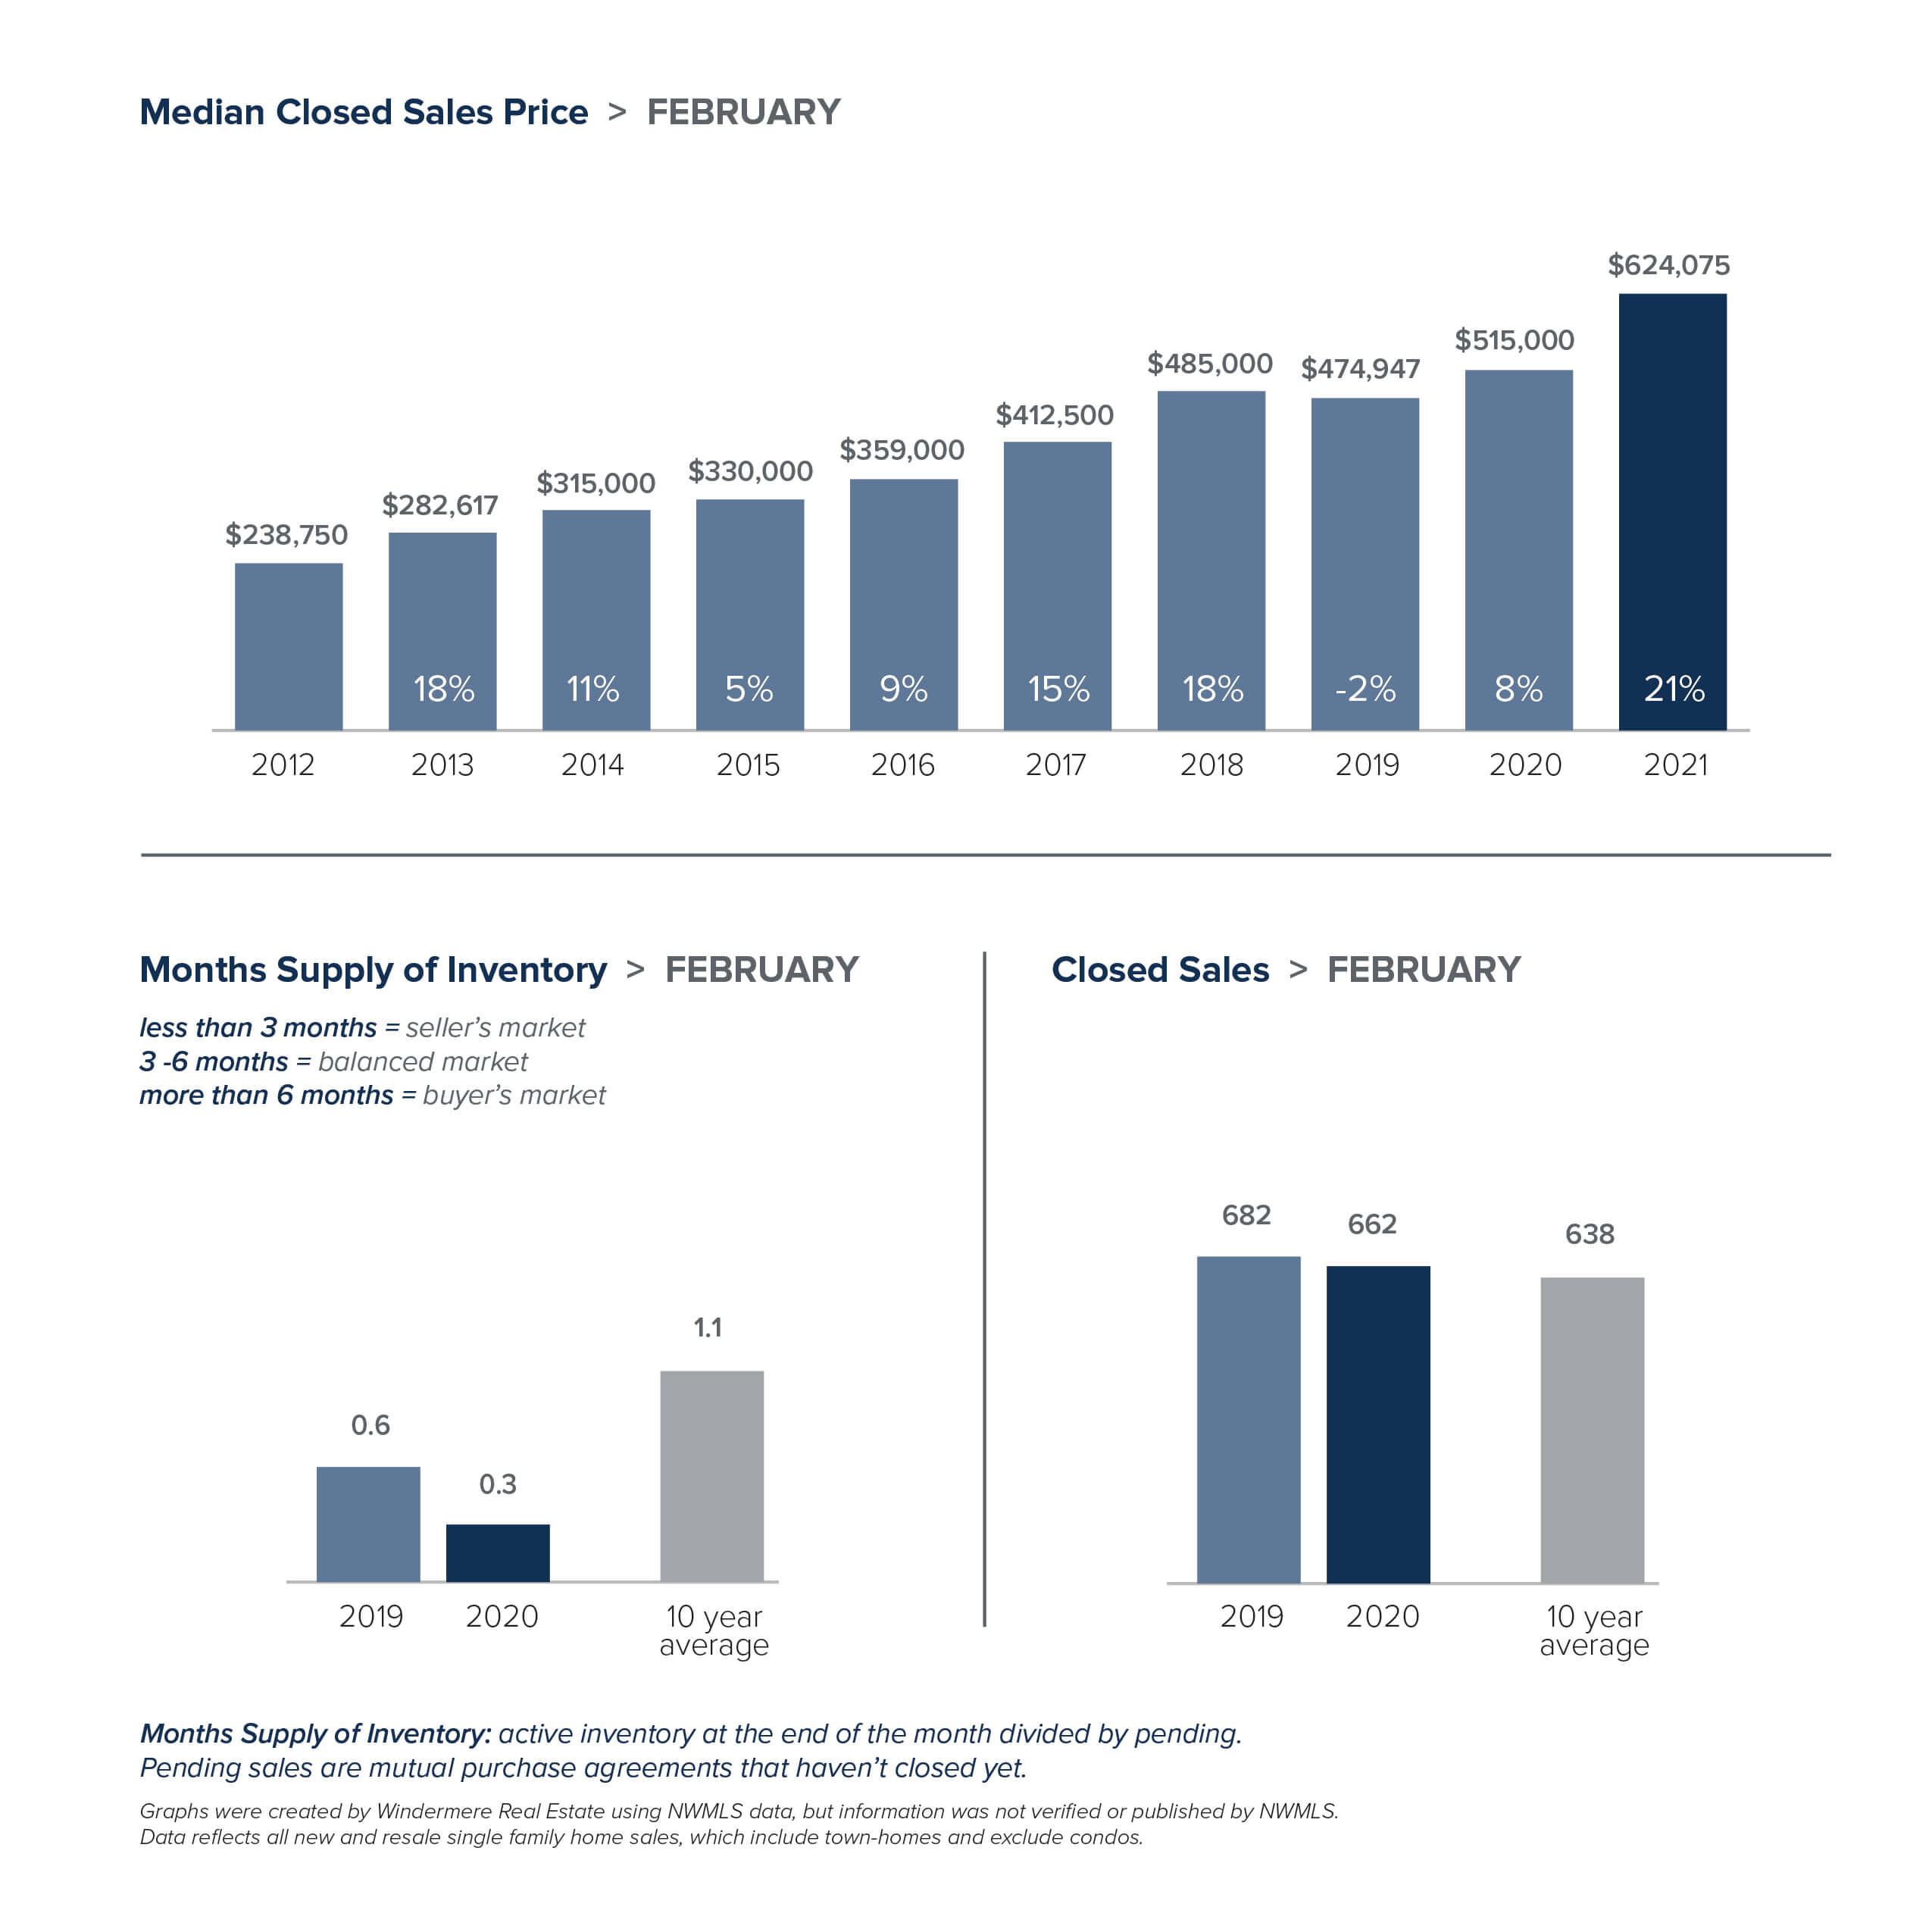
Neither the snowstorm nor the increase in mortgage rates dampened buyer demand in February. Lack of inventory continues to be a frustration as there are way more prospective buyers than there are homes for them to buy. As a result, prices continued their upward climb. While the number of homes for sale edged up, it was still far shy of demand. This is especially true of single-family homes. There were 41% fewer homes on the market in King County in February than the same time last year. In an indication of just how competitive the current market is, the entire Eastside ended the month with just 224 homes for sale. Inventory was even more scarce in Snohomish County where the entire county had just 283 homes for sale, a drop of 58% from a year ago. Condo shoppers have more options as the number of units on the market in King County increased 56% from last February. With inventory so slim, competition is fierce. 57% of King County properties that sold in February sold over the list price. The median sale price paid was 9% over list price. Both are record highs. Competition doesn’t show signs of easing any time soon. A hike in interest rates is expected to only increase buyer urgency. An average rate of 3.02% for a 30-year fixed-rate mortgage for the week ending March 4 is the first time since July that the benchmark mortgage rate climbed above 3%. The enormous imbalance between supply and demand sent single-family homes prices soaring throughout the region. In King County, the median home sold for $750,000, 11% higher than a year ago. Most areas in the county saw double-digit increases. Home prices on the Eastside jumped a whopping 28%. Seattle home prices were up 9%. In Snohomish County, the February $624,075 median price was up 21% from a year earlier and far surpassed the previous all-time high of $599,990 set in January. With seller review dates, escalation clauses and multiple offers now the norm it’s more important than ever for buyers to work with their broker to create a strategy that balances their wants and needs with their budget. The charts below provide a brief overview of market activity. If you are interested in more information, every Monday Windermere Chief Economist Matthew Gardner provides an update on the US economy and housing market. You can get Matthew’s latest update here. VIEW FULL SNOHOMISH COUNTY REPORT This post originally appeared on GetTheWReport.com
Local Market Update – March 2021
EASTSIDE
KING COUNTY
SEATTLE
SNOHOMISH COUNTY
Local Market Update – February 2021

This winter’s real estate market is looking more like a typical spring market. Sales were up, competition was fierce and prices continued to rise.
Lack of inventory still presents a huge issue. At the end of January there were only 1,055 single-family homes on the market in all of King County, 33% fewer than a year ago. If that wasn’t tight enough, Snohomish County had only 298 single-family homes for sale, 63% fewer than a year ago. Condos remain a bright spot for buyers frustrated by the frenzied market. January saw a nearly 50% increase in the number of condos for sale in King County. However, the increase in inventory didn’t translate into a drop in price. The median condo price was flat for the county, up 10% in Seattle and up 7% on the Eastside. Those looking for a relative bargain should consider Southwest and Southeast King County where the median condo prices were $254,275 and $269,900 respectively.
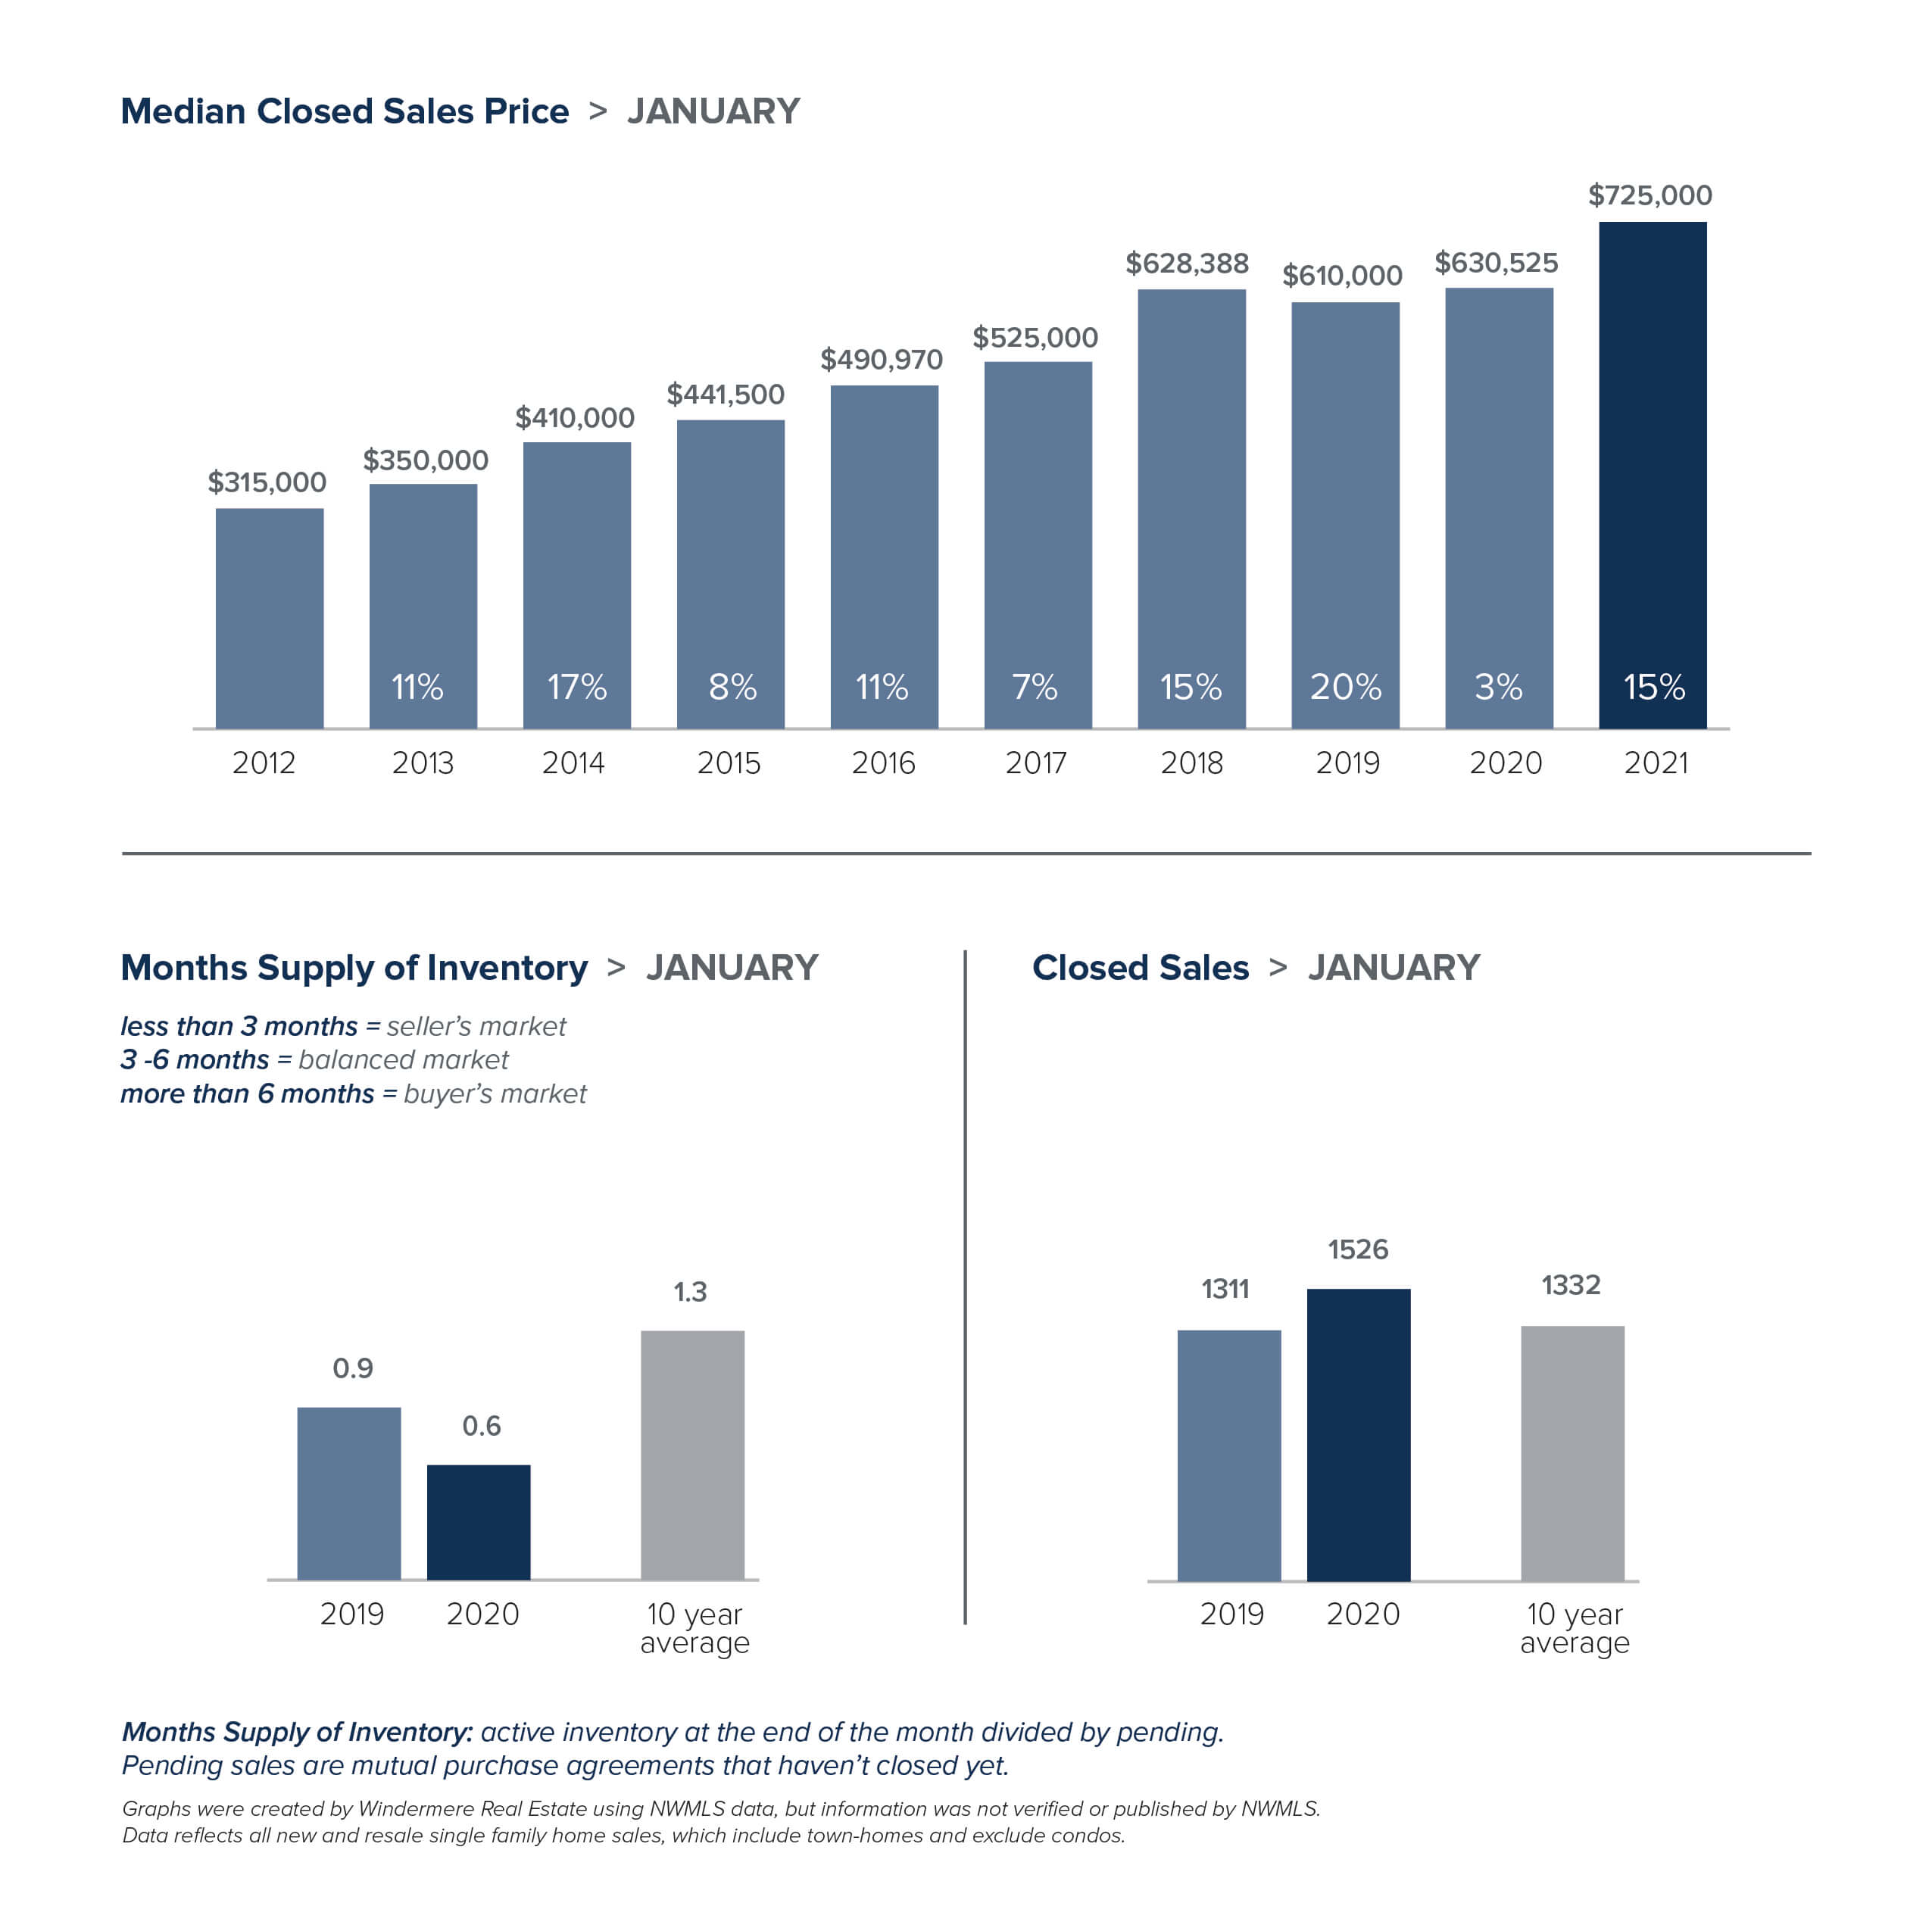
The large imbalance between supply and demand sent prices higher. Home prices here are climbing at the second-fastest rate in the nation. The median price of a single-family home in King County was $725,000, a 15% jump from a year ago. Seattle home prices increased 10% to $791,471. Inventory on the Eastside was down 58%, sending the median home price soaring 29% to $1.15 million. Snohomish County saw prices rise 18% to $599,990, well surpassing its previous high of $575,000.
While low interest rates take some of the sting out of rising prices, multiple offers over asking price have become the norm and are expected to continue. The easing of COVID restrictions may add yet more competition. Both King and Snohomish counties have moved into Phase 2 of the Healthy Washington plan, which allows open houses to resume with up to 10 people socially distanced.
All signs point to this strong seller’s market continuing for some time. The person who represents you as a buyer can make the difference in owning a home or not. Brokers are advising buyers to create a plan that prioritizes their wish list and sets realistic expectations in this hyper-competitive market.
The charts below provide a brief overview of market activity. If you are interested in more information, every Monday Windermere Chief Economist Matthew Gardner provides an update regarding the impact of COVID-19 on the US economy and housing market. You can get Matthew’s latest update here.
EASTSIDE

KING COUNTY
SEATTLE

SNOHOMISH COUNTY

VIEW FULL SNOHOMISH COUNTY REPORT
This post originally appeared on GetTheWReport.com
Local Market Update – January 2021

The end of 2020 marked a most unusual year, and the real estate market was no exception. While homes sales usually take a holiday during December, this year saw the continuation of an exceptionally strong and competitive market. New listings, closed sales and home prices all went up. With supply nowhere close to meeting demand, the strong market is expected to extend into 2021.
Inventory continues to be the biggest challenge for buyers. While King County had a 62% increase in new listings compared to a year ago, homes were snapped up quickly, leaving the county with just over two weeks of available inventory at the end of the month. The supply of single-family homes was down 35% year-over-year. Buyers considering a condo had far more choices. Inventory was up 45%, but at about five weeks of available units the condo market is still significantly short of the four month supply that is considered balanced. Inventory in Snohomish County was even more strained, with the month end showing only a one-week supply of homes. At the end of December there were only 373 homes on the market in all of Snohomish County, a 63% drop from a year ago. With inventory this tight, it’s more important than ever for buyers to work with their agent on a strategic plan for getting the home they want.
Low inventory and high demand continued to push prices upward. The median single-family home price in King County was up 10% over a year ago to $740,000. Price increases varied significantly by area. Seattle home prices were up 10%. The traditionally more affordable area of Southwest King County, which includes Federal Way and Burien, saw prices jump 15%. And on the Eastside, the most expensive market in King County, home prices soared 17% — the largest increase of any area in the county. Home prices in Snohomish County rose 12% to $573,495, just shy of its all-time high of $575,000.
With 2021 ushering in a new record low for interest rates, and inventory at its tightest in recent memory, 2021 is expected to remain a very competitive market.
Windermere Chief Economist Matthew Gardner’s prediction: “As we move into 2021, I expect continued strong demand from buyers, but unfortunately, the likelihood that there will be any significant increase in inventory is slim. As a result, I believe prices will continue to rise, which is good news for sellers, but raises concerns about affordability. This, combined with modestly rising mortgage rates, could end up taking some steam out of the market but overall, I expect housing to continue being a very bright spot in the Puget Sound economy.”
The charts below provide a brief overview of market activity. If you are interested in more information, every Monday Windermere Chief Economist Matthew Gardner provides an update regarding the impact of COVID-19 on the US economy and housing market. You can get Matthew’s latest update here.
EASTSIDE

KING COUNTY

SEATTLE

SNOHOMISH COUNTY

VIEW FULL SNOHOMISH COUNTY REPORT
This post originally appeared on GetTheWReport.com
Local Market Update – December 2020

Nothing about 2020 is normal, and that includes real estate trends. The housing market typically slows significantly during the holiday season, but that is not the case this year. Buyer interest is strong, sales are up, and prices have followed suit.
A recent report ranked our area as the most competitive real estate market in the country, with 71% of homes selling within two weeks. While the number of new listings in November were up compared to a year ago, there just wasn’t enough inventory to meet the current surge in demand.
In King County there were 37% fewer single-family homes on the market – 1,621 homes this November vs. 2,592 a year ago. Inventory in Snohomish County is even more strained. At the end of the month there were just 416 homes for sale as compared to 1,204 a year ago, a 65% drop. Both counties had about a two week supply of homes at the end of November. A four month supply of inventory is considered balanced. Buyers in the market for a condominium in King County had much more options. Condo inventory was up 39% over last year.
The inventory-starved market sent home prices higher. The median single-family home price in King County was up 10% over a year ago to $730,500. Home prices in Snohomish County rose 14% to $566,000. In a survey of homebuyers looking for a home during Covid-19, 82% said they would go over budget to get their ideal home. Record-low interest rates have helped soften the blow of soaring prices a bit. According to Freddie Mac, rates on a 30-year fixed-rate mortgage fell to their lowest level, at 2.71%, for the 14th time this year.
With low inventory and high demand, buyers need to be ready to compete. That means being pre-approved or willing to offer cash, and working with an agent on a plan that includes counter-offers, escalation clauses and other strategies to help win the sale. As many consider working remotely long-term, our home has become more important to us than ever.
The charts below provide a brief overview of market activity. If you are interested in more information, every Monday Windermere Chief Economist Matthew Gardner provides an update regarding the impact of COVID-19 on the US economy and housing market. You can get Matthew’s latest update here.
EASTSIDE

KING COUNTY

SEATTLE

SNOHOMISH COUNTY

VIEW FULL SNOHOMISH COUNTY REPORT
This post originally appeared on GetTheWReport.com
Local Market Update – November 2020

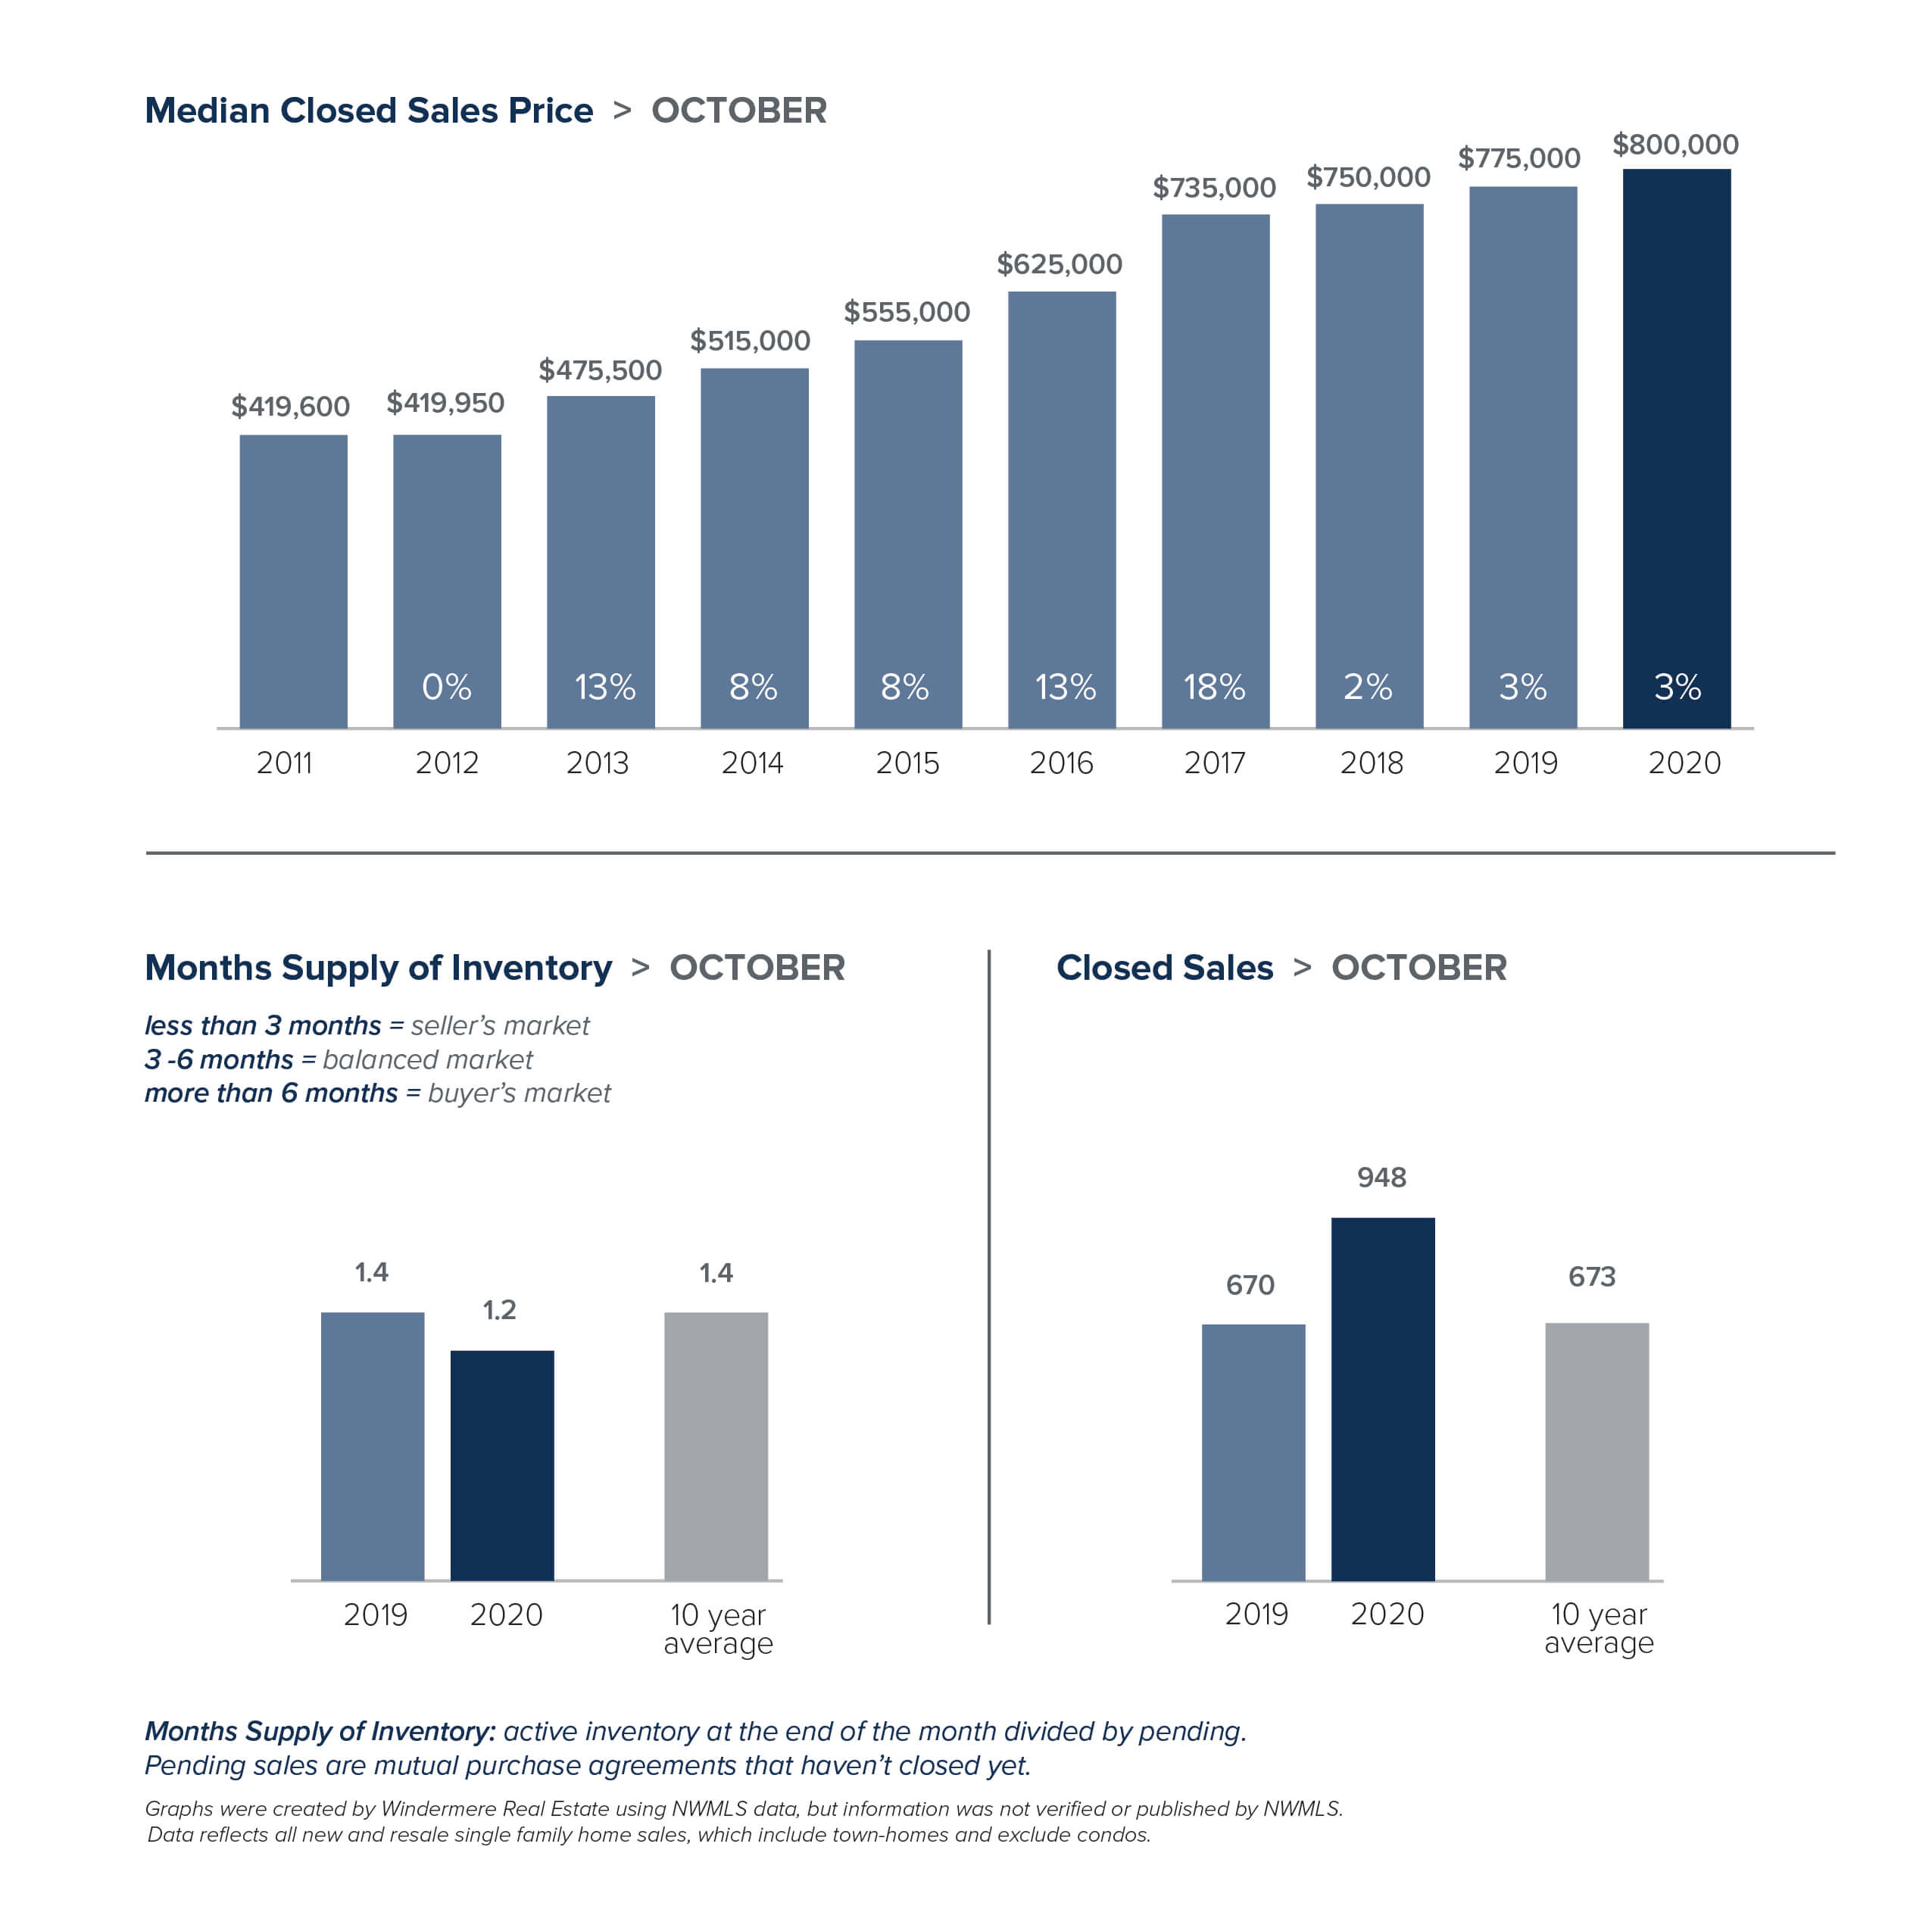
The number of people who can work remotely may be changing the way we view our homes, but one trend has not changed. The local housing market in October remained unseasonably hot. And that doesn’t show signs of changing any time soon.
October saw continued low inventory and record-level sales, with the number of sales exceeding that of 2019 year-to-date.
While new listings are on the rise, they are being snapped up quickly and many homes are selling in a matter of days. In King County there were 38% fewer single-family homes on the market as compared to a year ago. Snohomish County had 59% fewer listings. A four-month supply of homes for sale is considered a balanced market, but King and Snohomish counties currently have less than one month of supply.
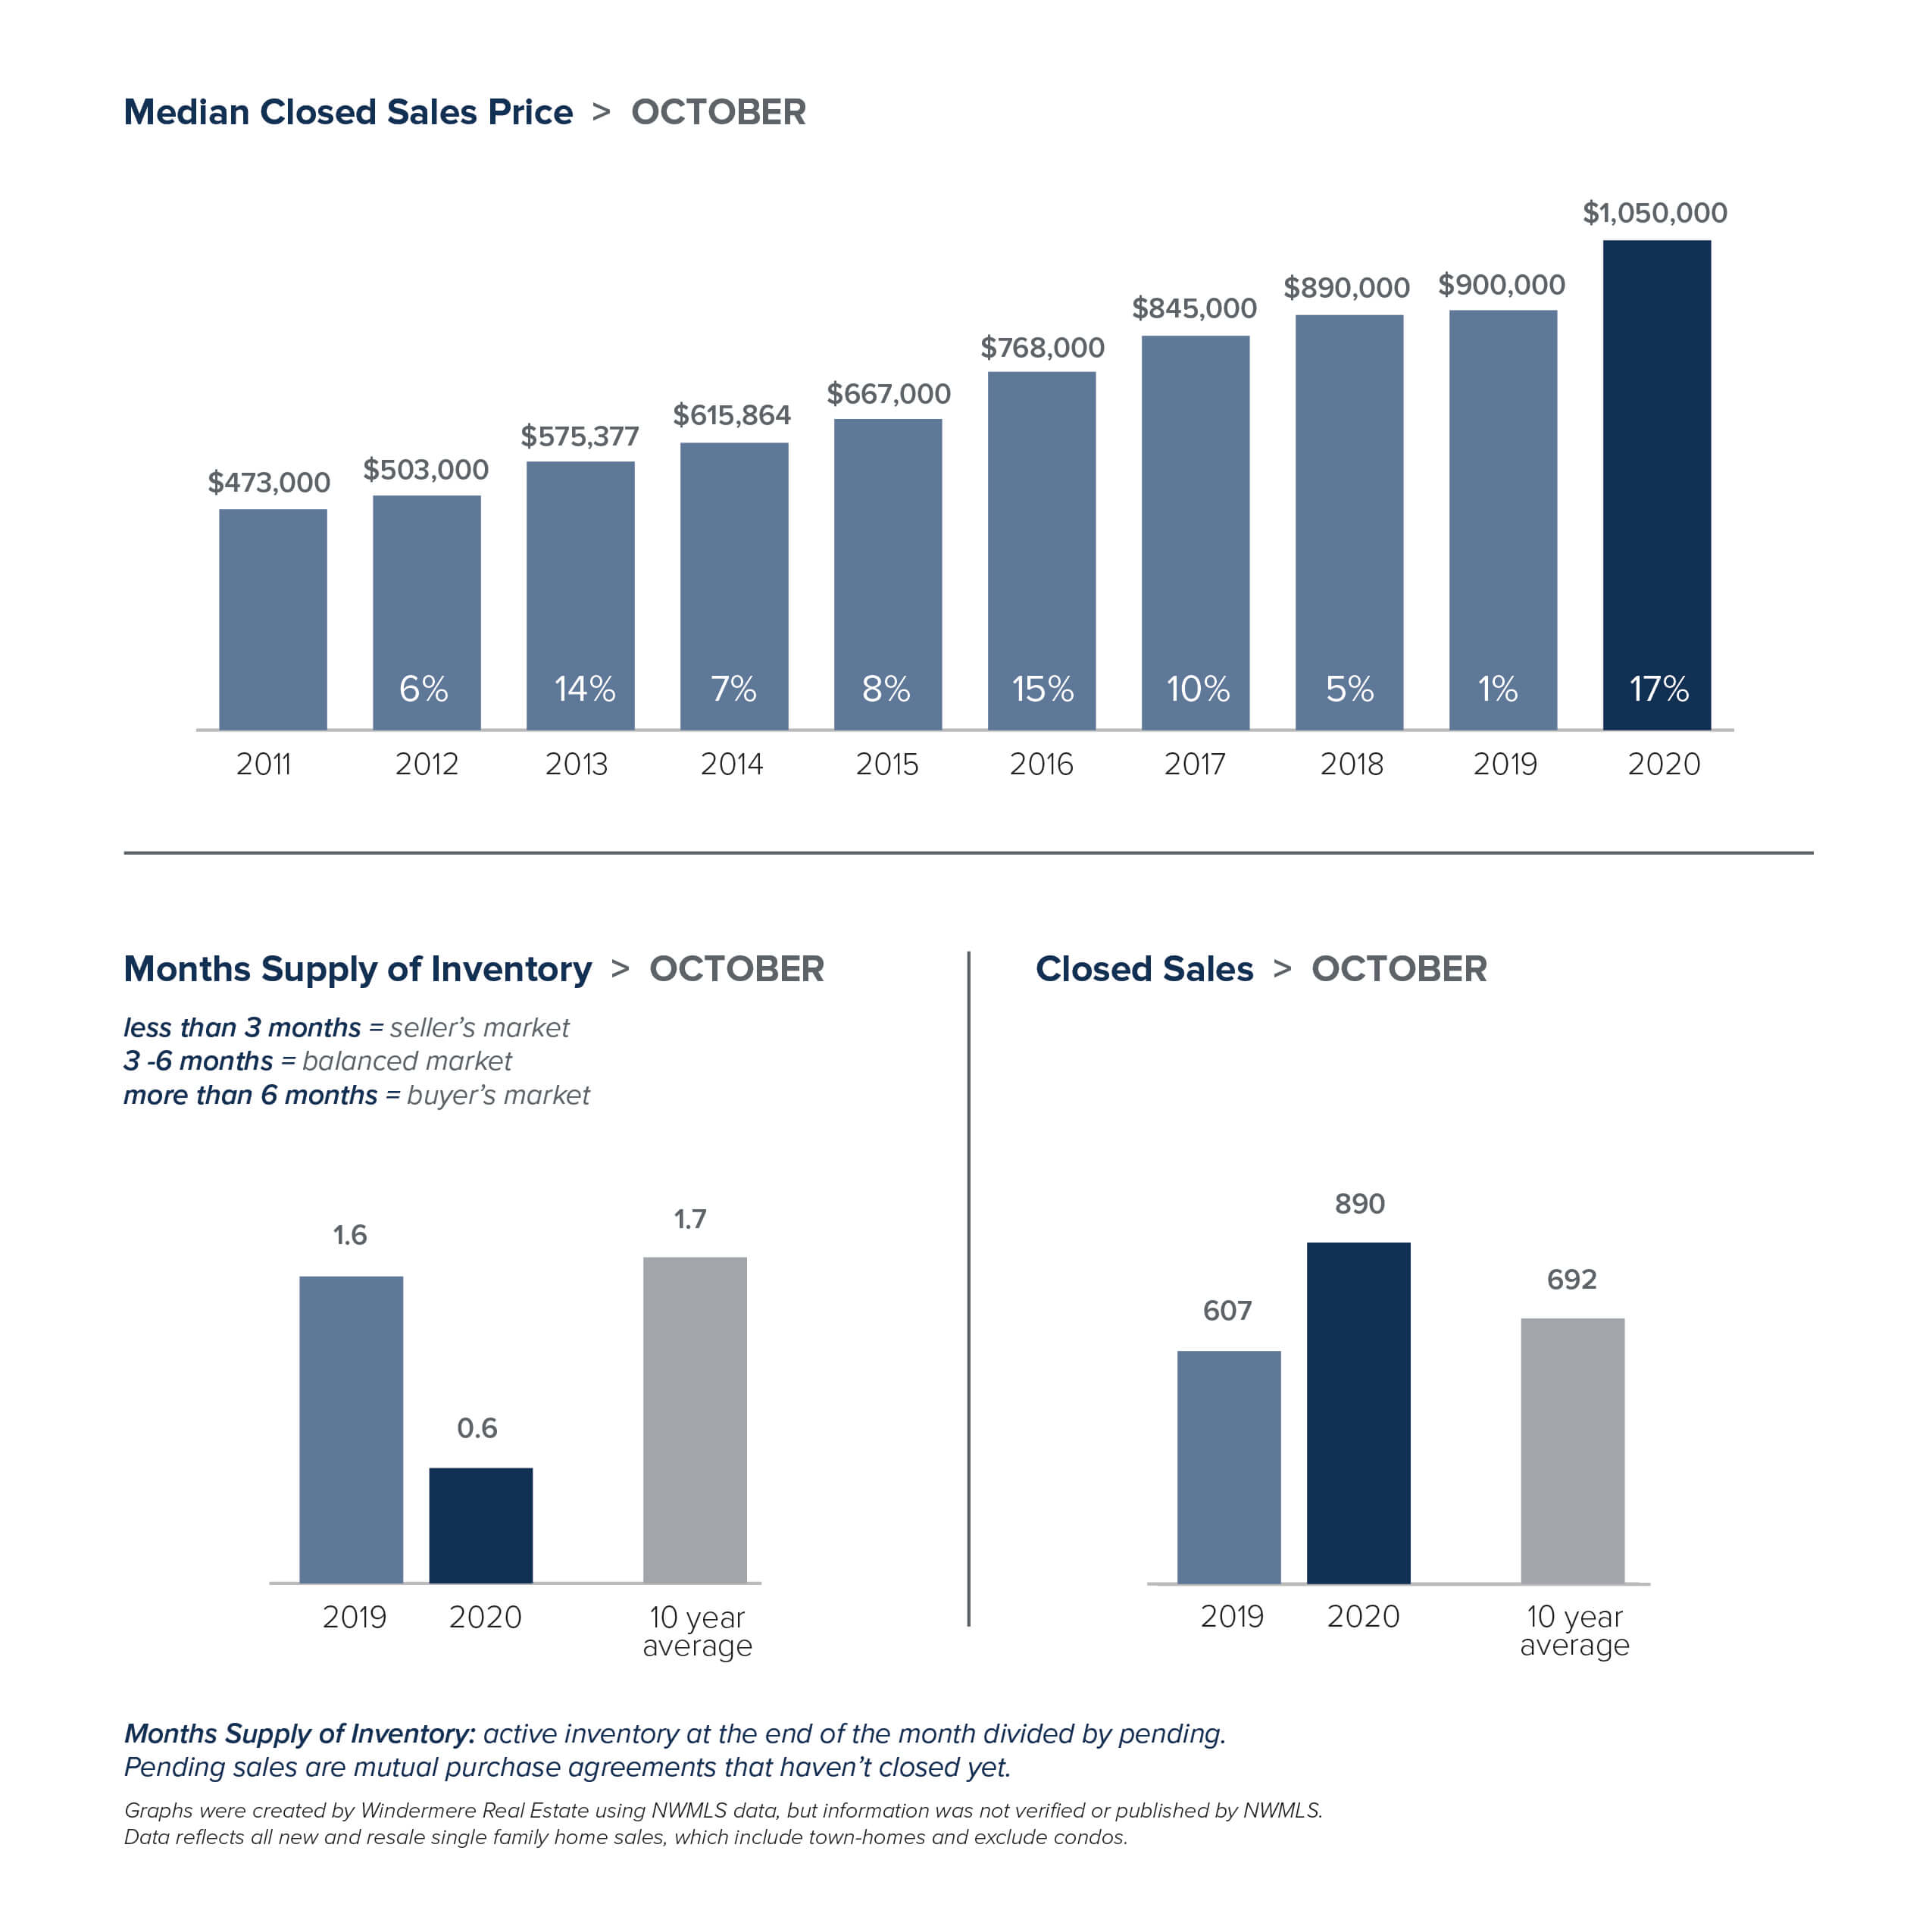
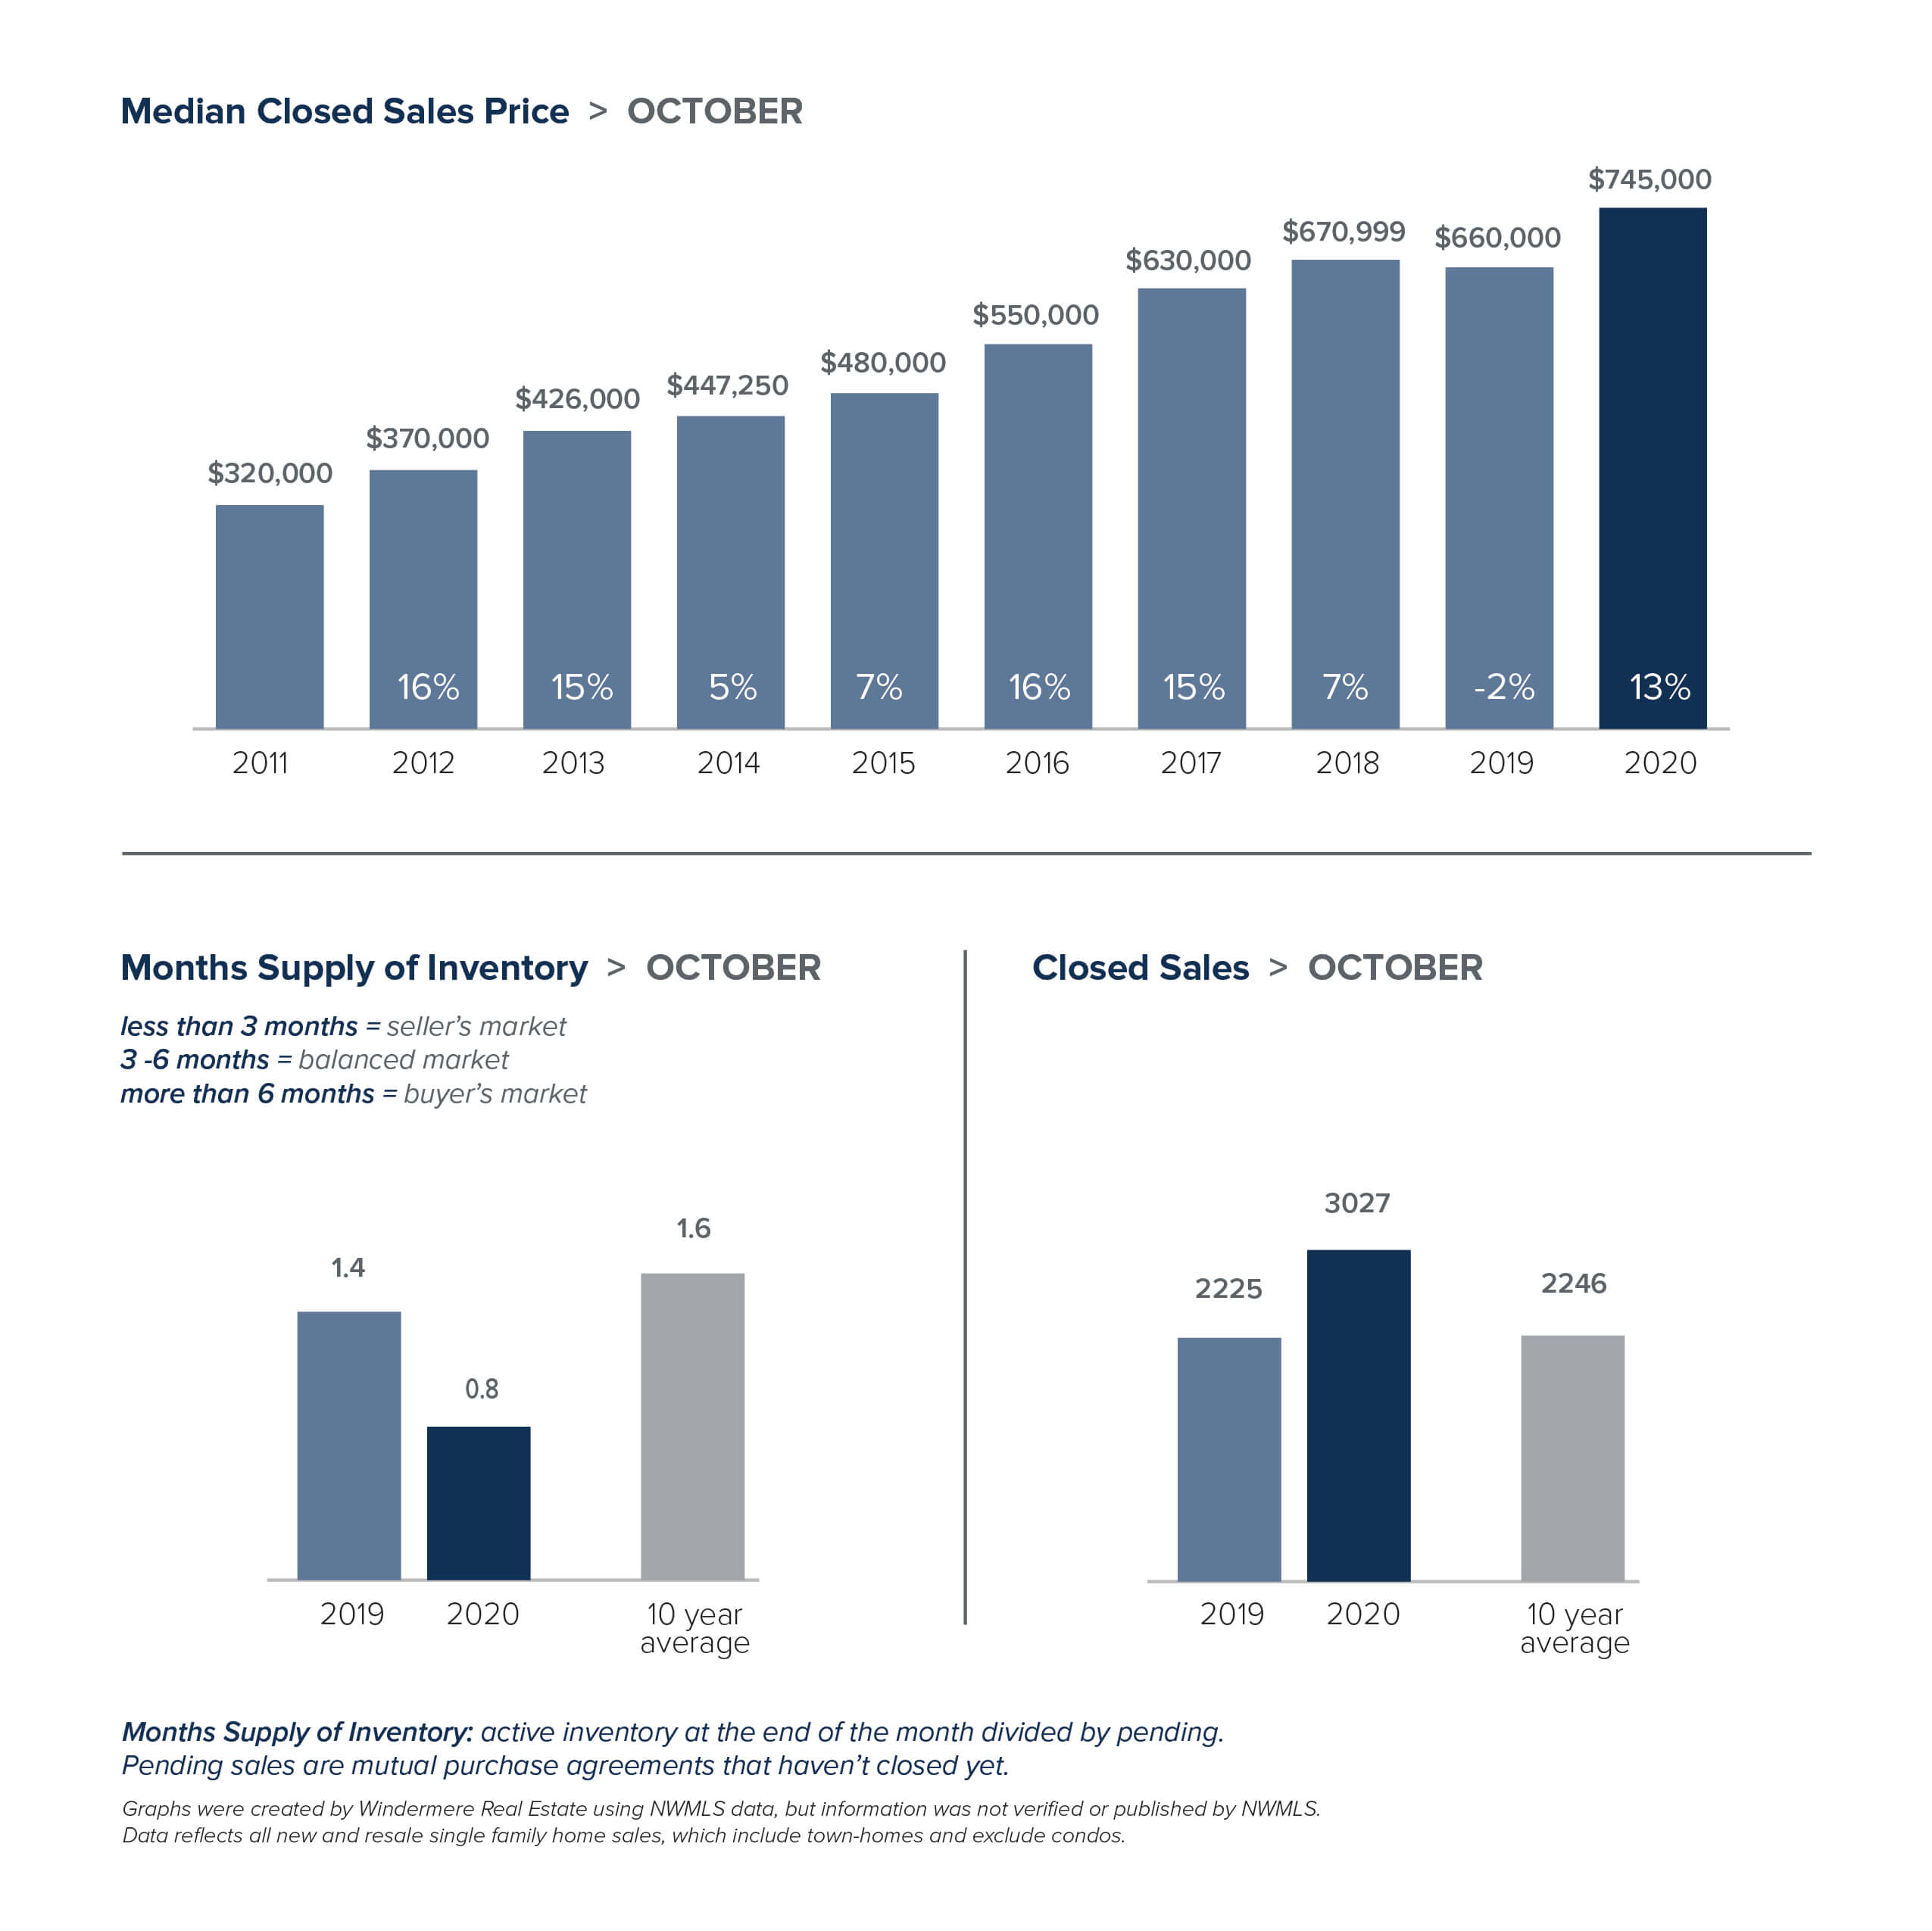
With supply unable to keep up with demand, home prices are escalating at double-digit rates. The median single-family home price in King County rose 14% over a year ago to $745,000. Prices in Snohomish County jumped 17% year-over-year to a record high of $579,972. About half the homes that closed in October sold for over the asking price as compared to about a quarter of the homes the same time last year.
The real estate market here is uncommonly resilient. Growing employment in major tech industries and an enviable quality of life have made our region one of the fastest growing areas in the country. With interest rates remaining at record lows, we may well skip the traditional slowing in the winter market altogether.
The charts below provide a brief overview of market activity. If you are interested in more information, every Monday Windermere Chief Economist Matthew Gardner provides an update regarding the impact of COVID-19 on the US economy and housing market. You can get Matthew’s latest update here.
EASTSIDE
KING COUNTY
SEATTLE
SNOHOMISH COUNTY

VIEW FULL SNOHOMISH COUNTY REPORT
This post originally appeared on GetTheWReport.com
Local Market Update – October 2020

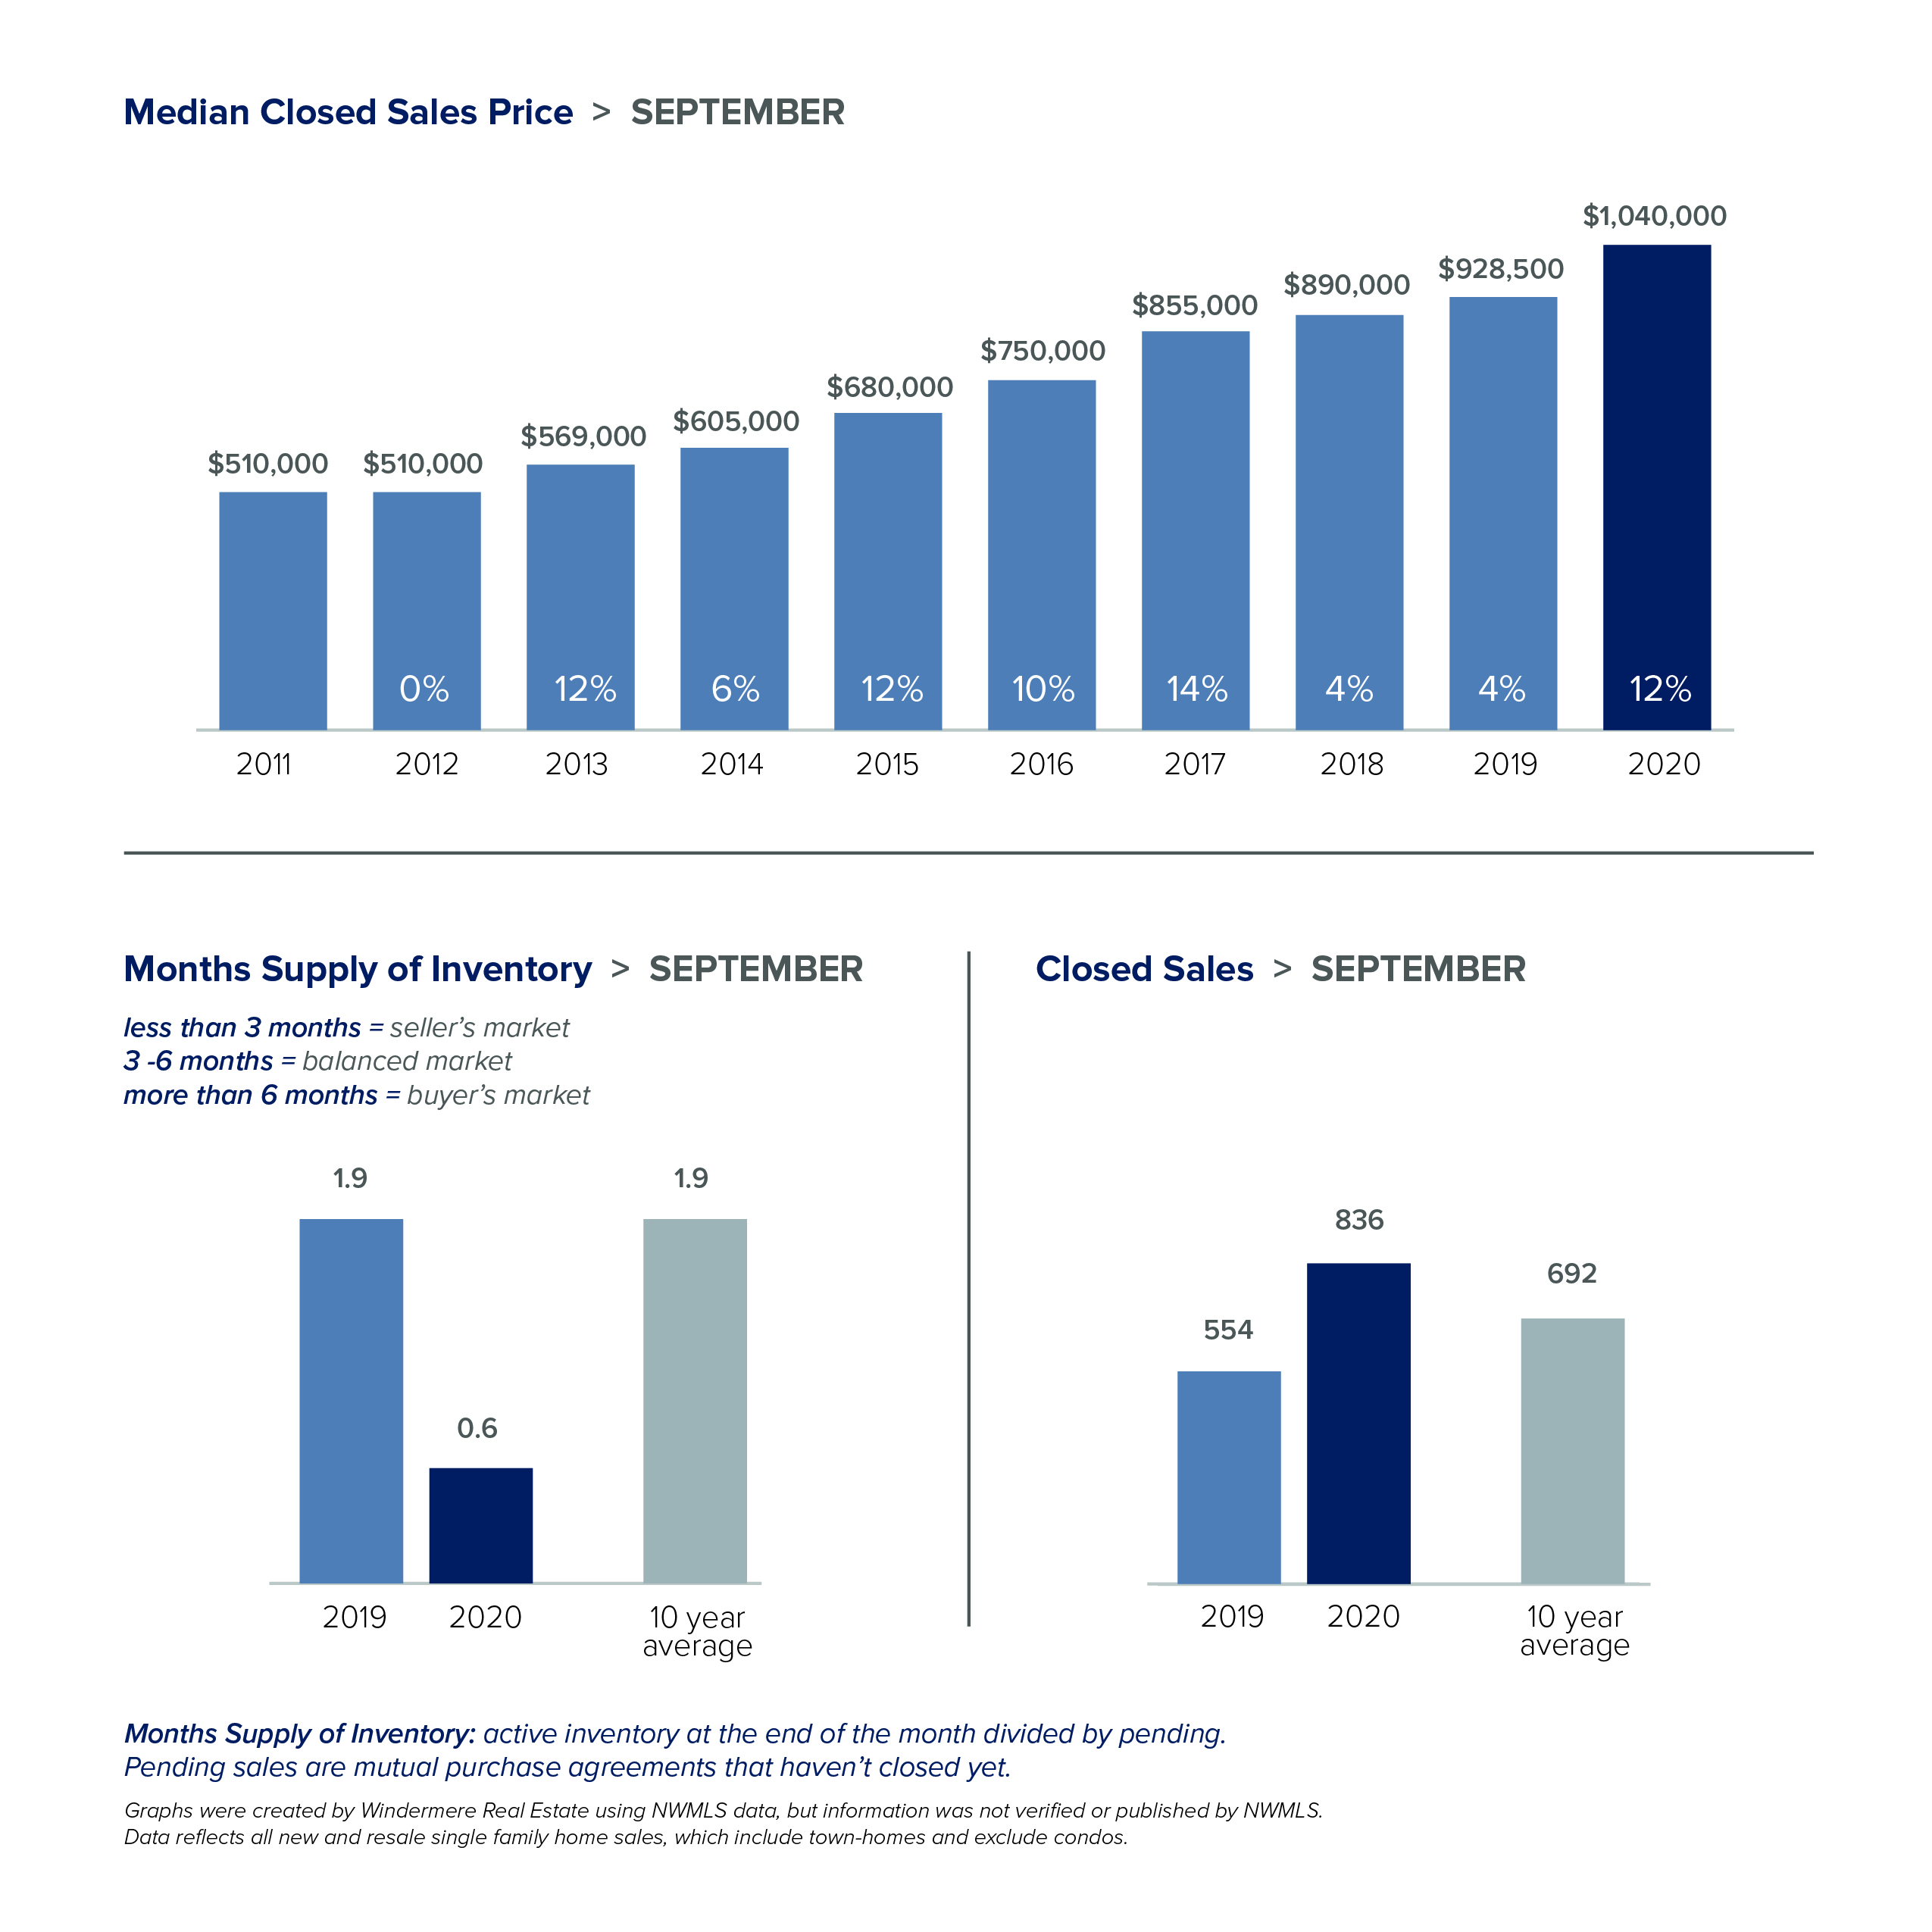
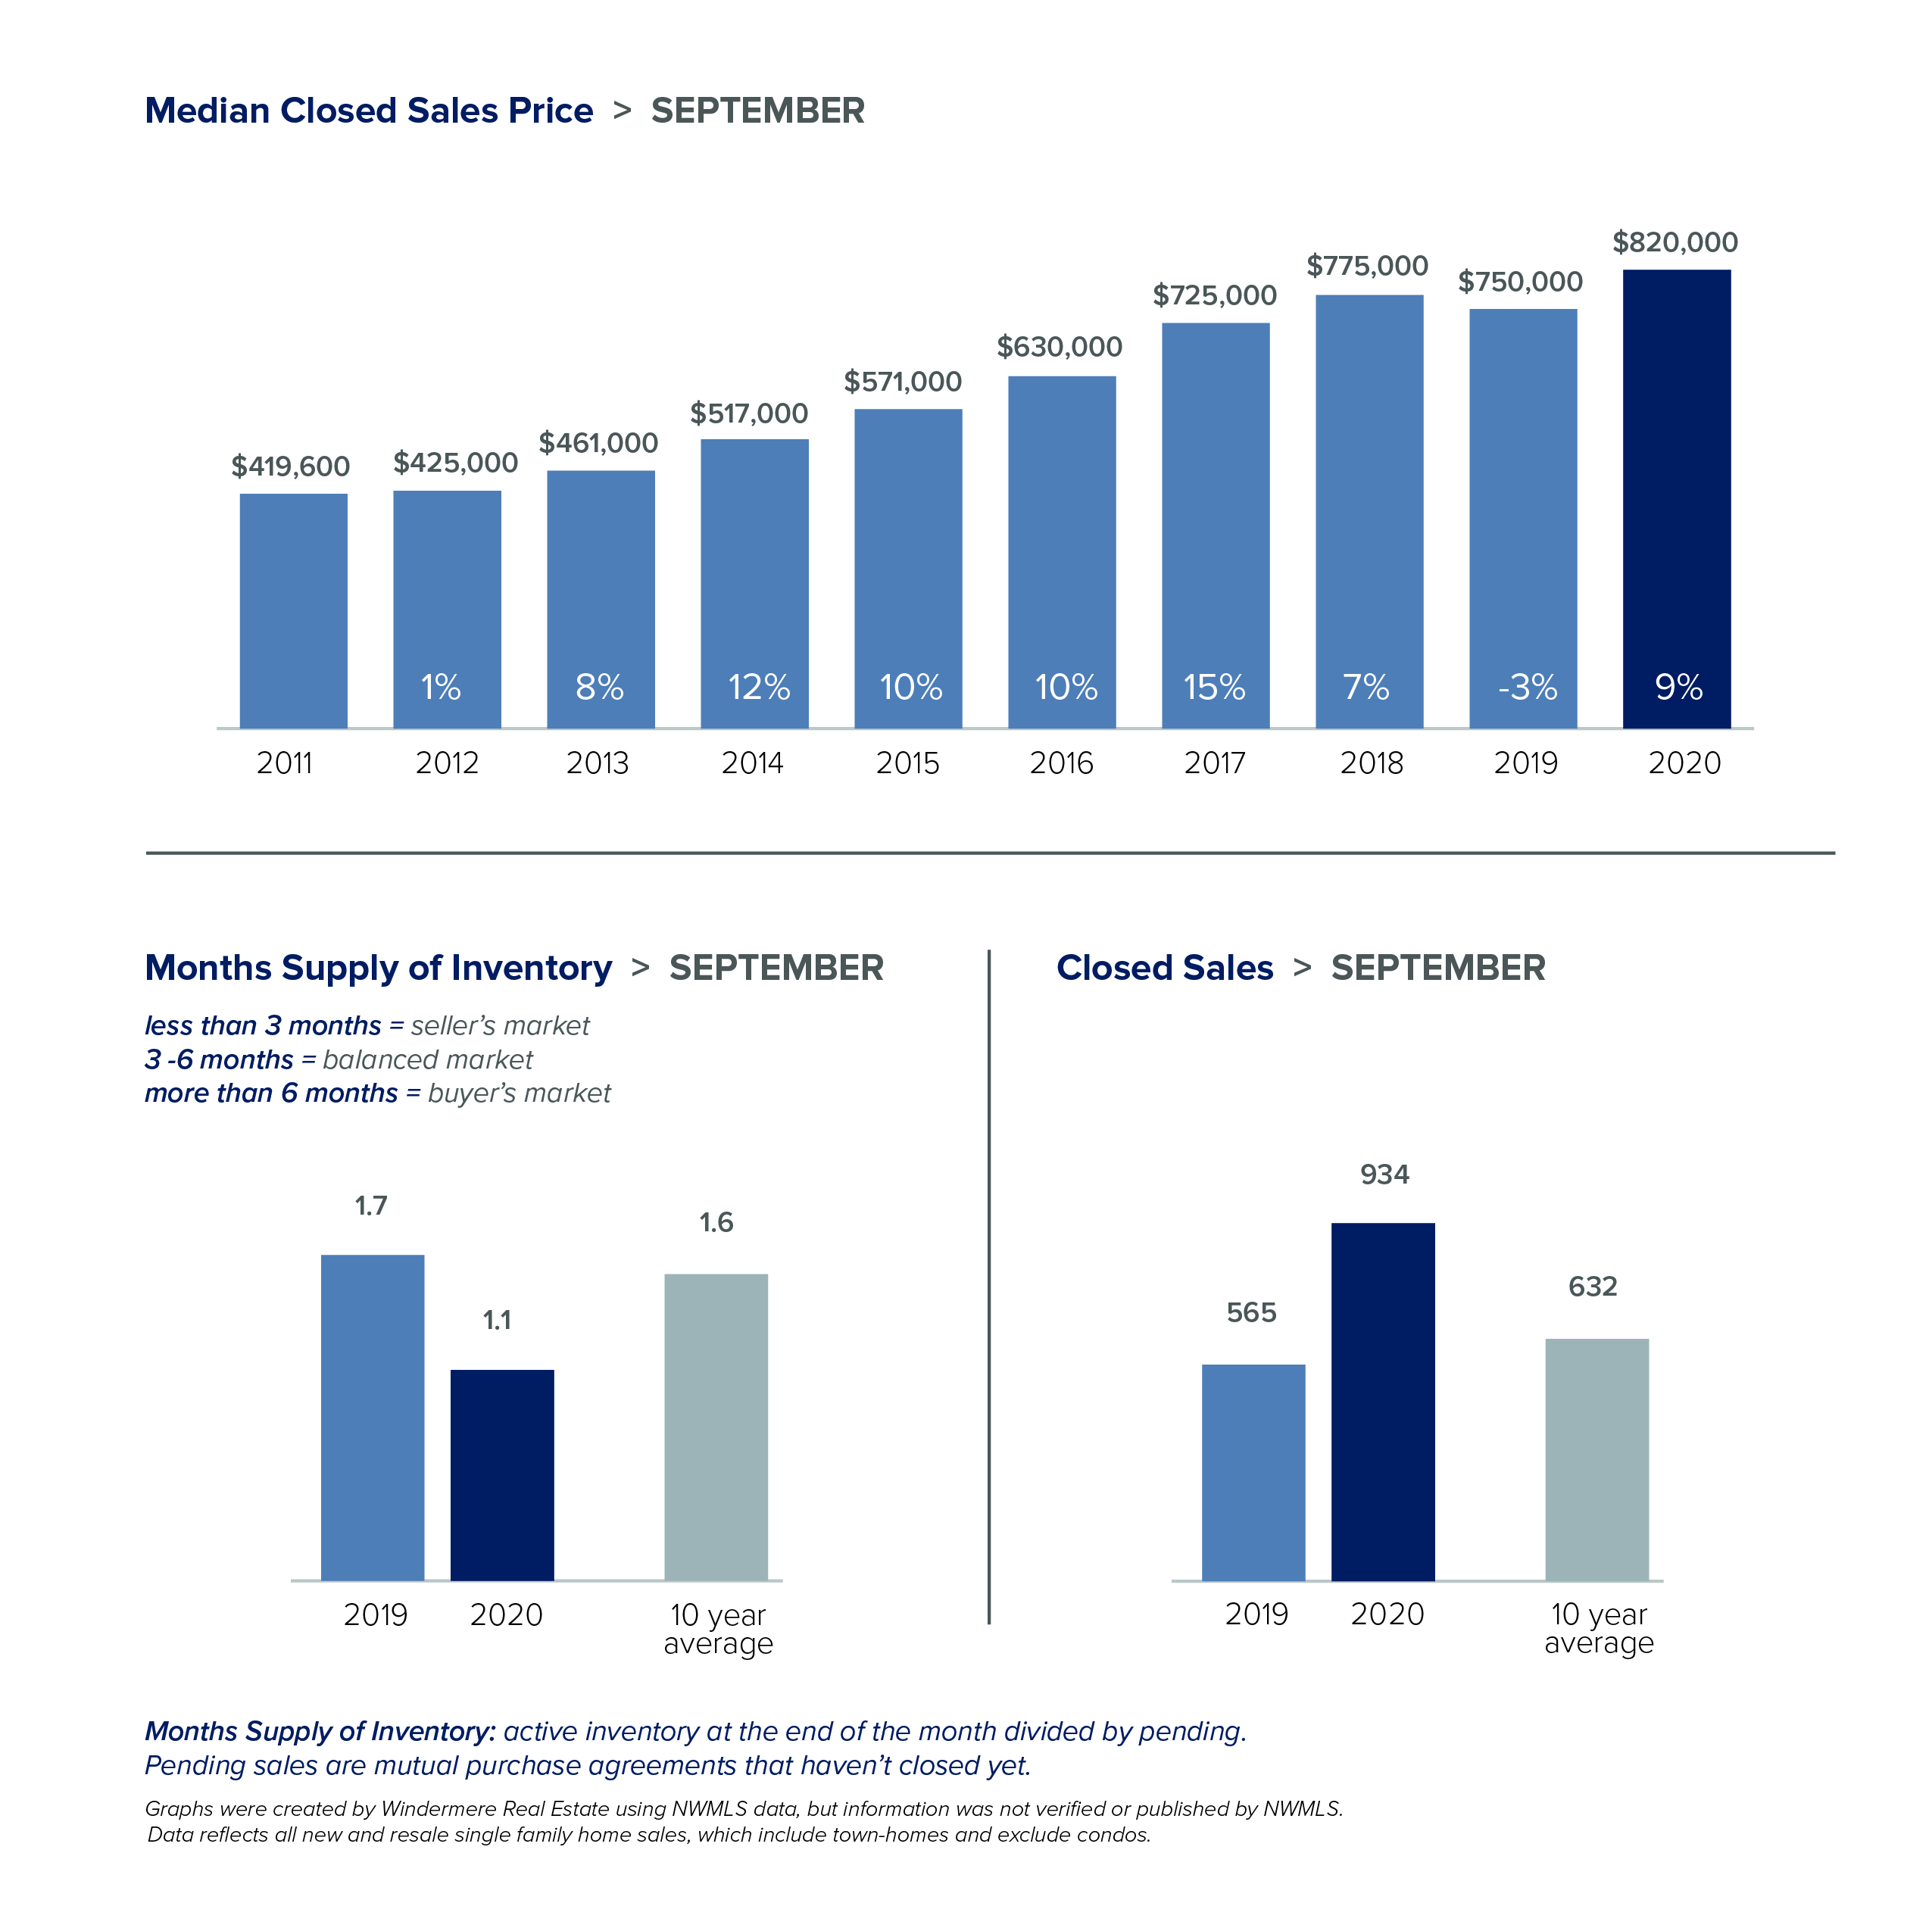
While daily life may seem unpredictable, the local real estate market remains extremely stable. Activity in September acted more like the traditional peak spring market with home sales soaring and prices hitting record highs. Inventory remains very tight and new listings are selling quickly in every price range.
There just aren’t enough homes on the market to meet demand. King County had about half the inventory of a year ago. Snohomish County had 63% fewer available homes. On the other hand, the number of condos on the market in King County jumped by 24% over last September. Brokers attribute the flood of new inventory to COVID remote workers looking to trade their in-city condo for more living space. Despite the increase in inventory, condo prices rose 8% in September and pending sales — the best indicator of current demand — shot up 36% over the same period last year.
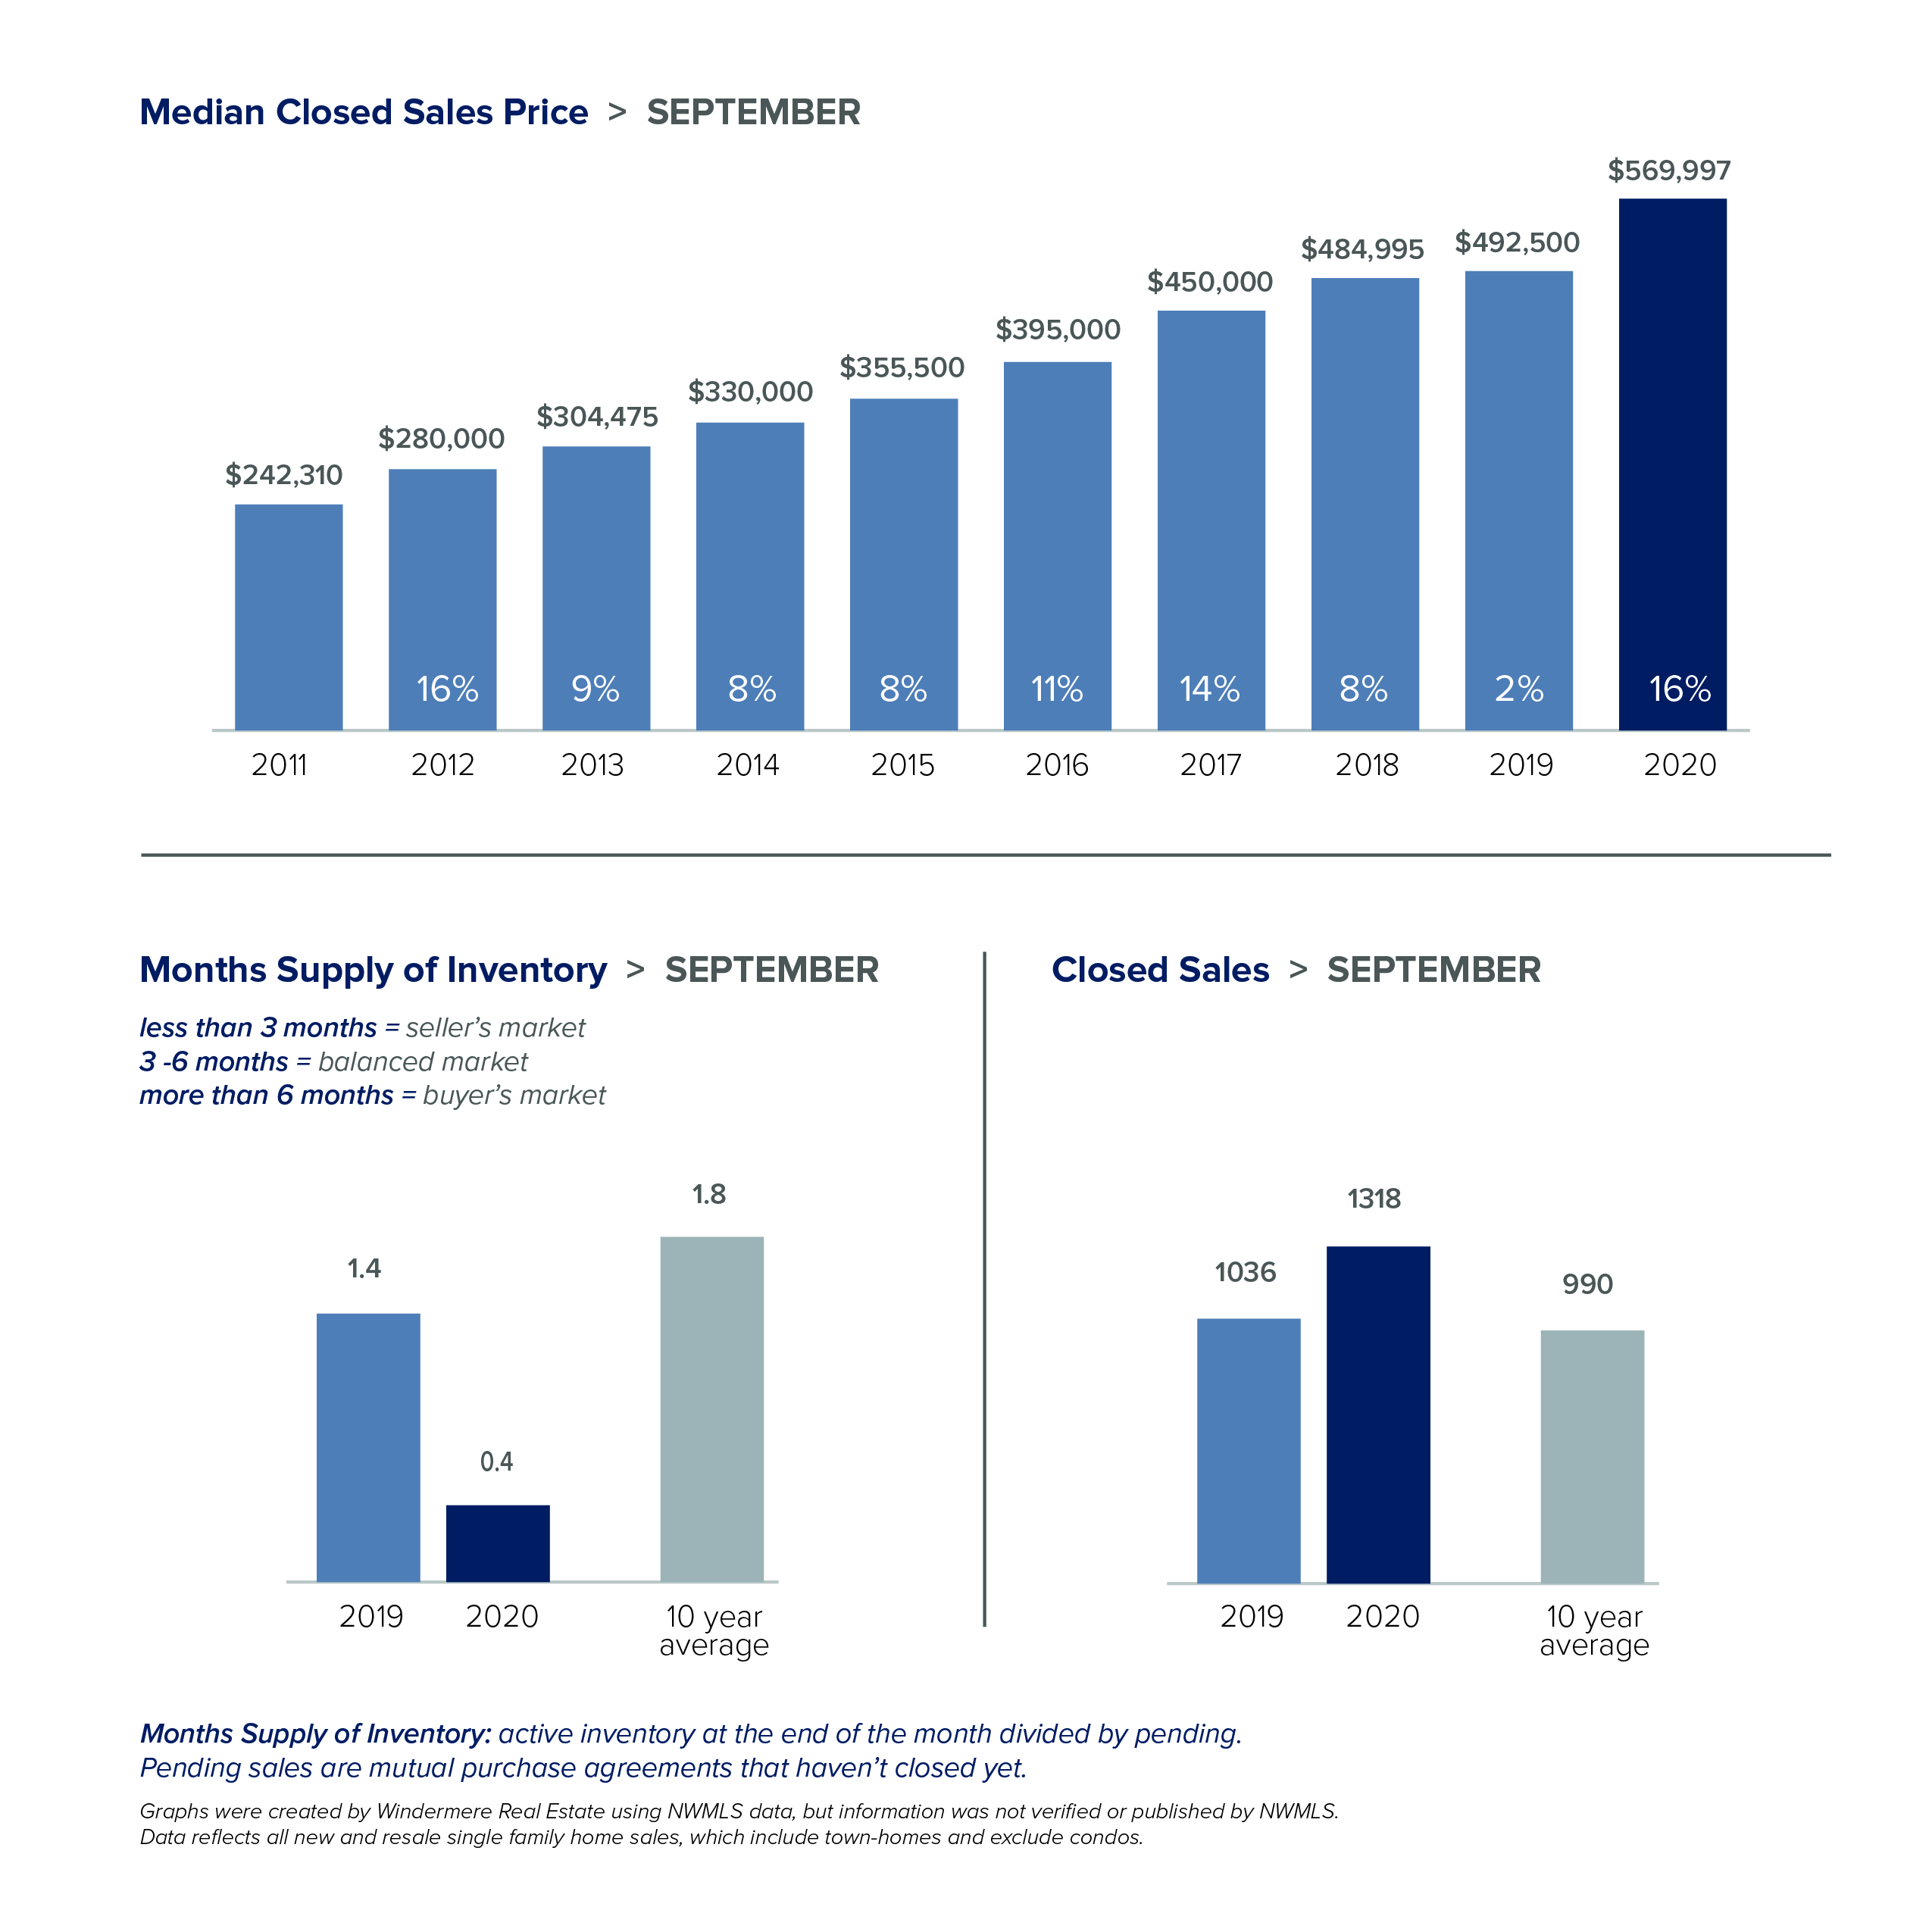
The slim supply of single-family homes means bidding wars and all-cash offers were the norm, driving prices to record highs. King County saw the third consecutive month of record-setting values. The median home price hit $753,600 in September, a 14% jump over last year. Prices in Snohomish County soared 16% from a year ago to $569,997, just shy of its all-time high of $575,000. For both counties, half the homes sold for over list price in September as compared with just a quarter of the homes a year ago.
The market doesn’t show signs of cooling off any time soon. In September the greater Northwest area saw the highest number of transactions since June 2018. Pending sales were up 32% in King County and 29% in Snohomish County. Interest rates continue to be at historic lows. With the area posting some of the fastest population growth in the country, expect the market to stay unseasonably hot.
The charts below provide a brief overview of market activity. If you are interested in more information, every Monday Windermere Chief Economist Matthew Gardner provides an update regarding the impact of COVID-19 on the US economy and housing market. You can get Matthew’s latest update here.
EASTSIDE
KING COUNTY

SEATTLE
SNOHOMISH COUNTY
VIEW FULL SNOHOMISH COUNTY REPORT
This post originally appeared on
The charts below provide a brief overview of market activity. If you are interested in more information, every Monday Windermere Chief Economist Matthew Gardner provides an update regarding the impact of COVID-19 on the US economy and housing market. You can get Matthew’s latest update here. VIEW FULL SNOHOMISH COUNTY REPORT This post originally appeared on
Local Market Update – September 2020

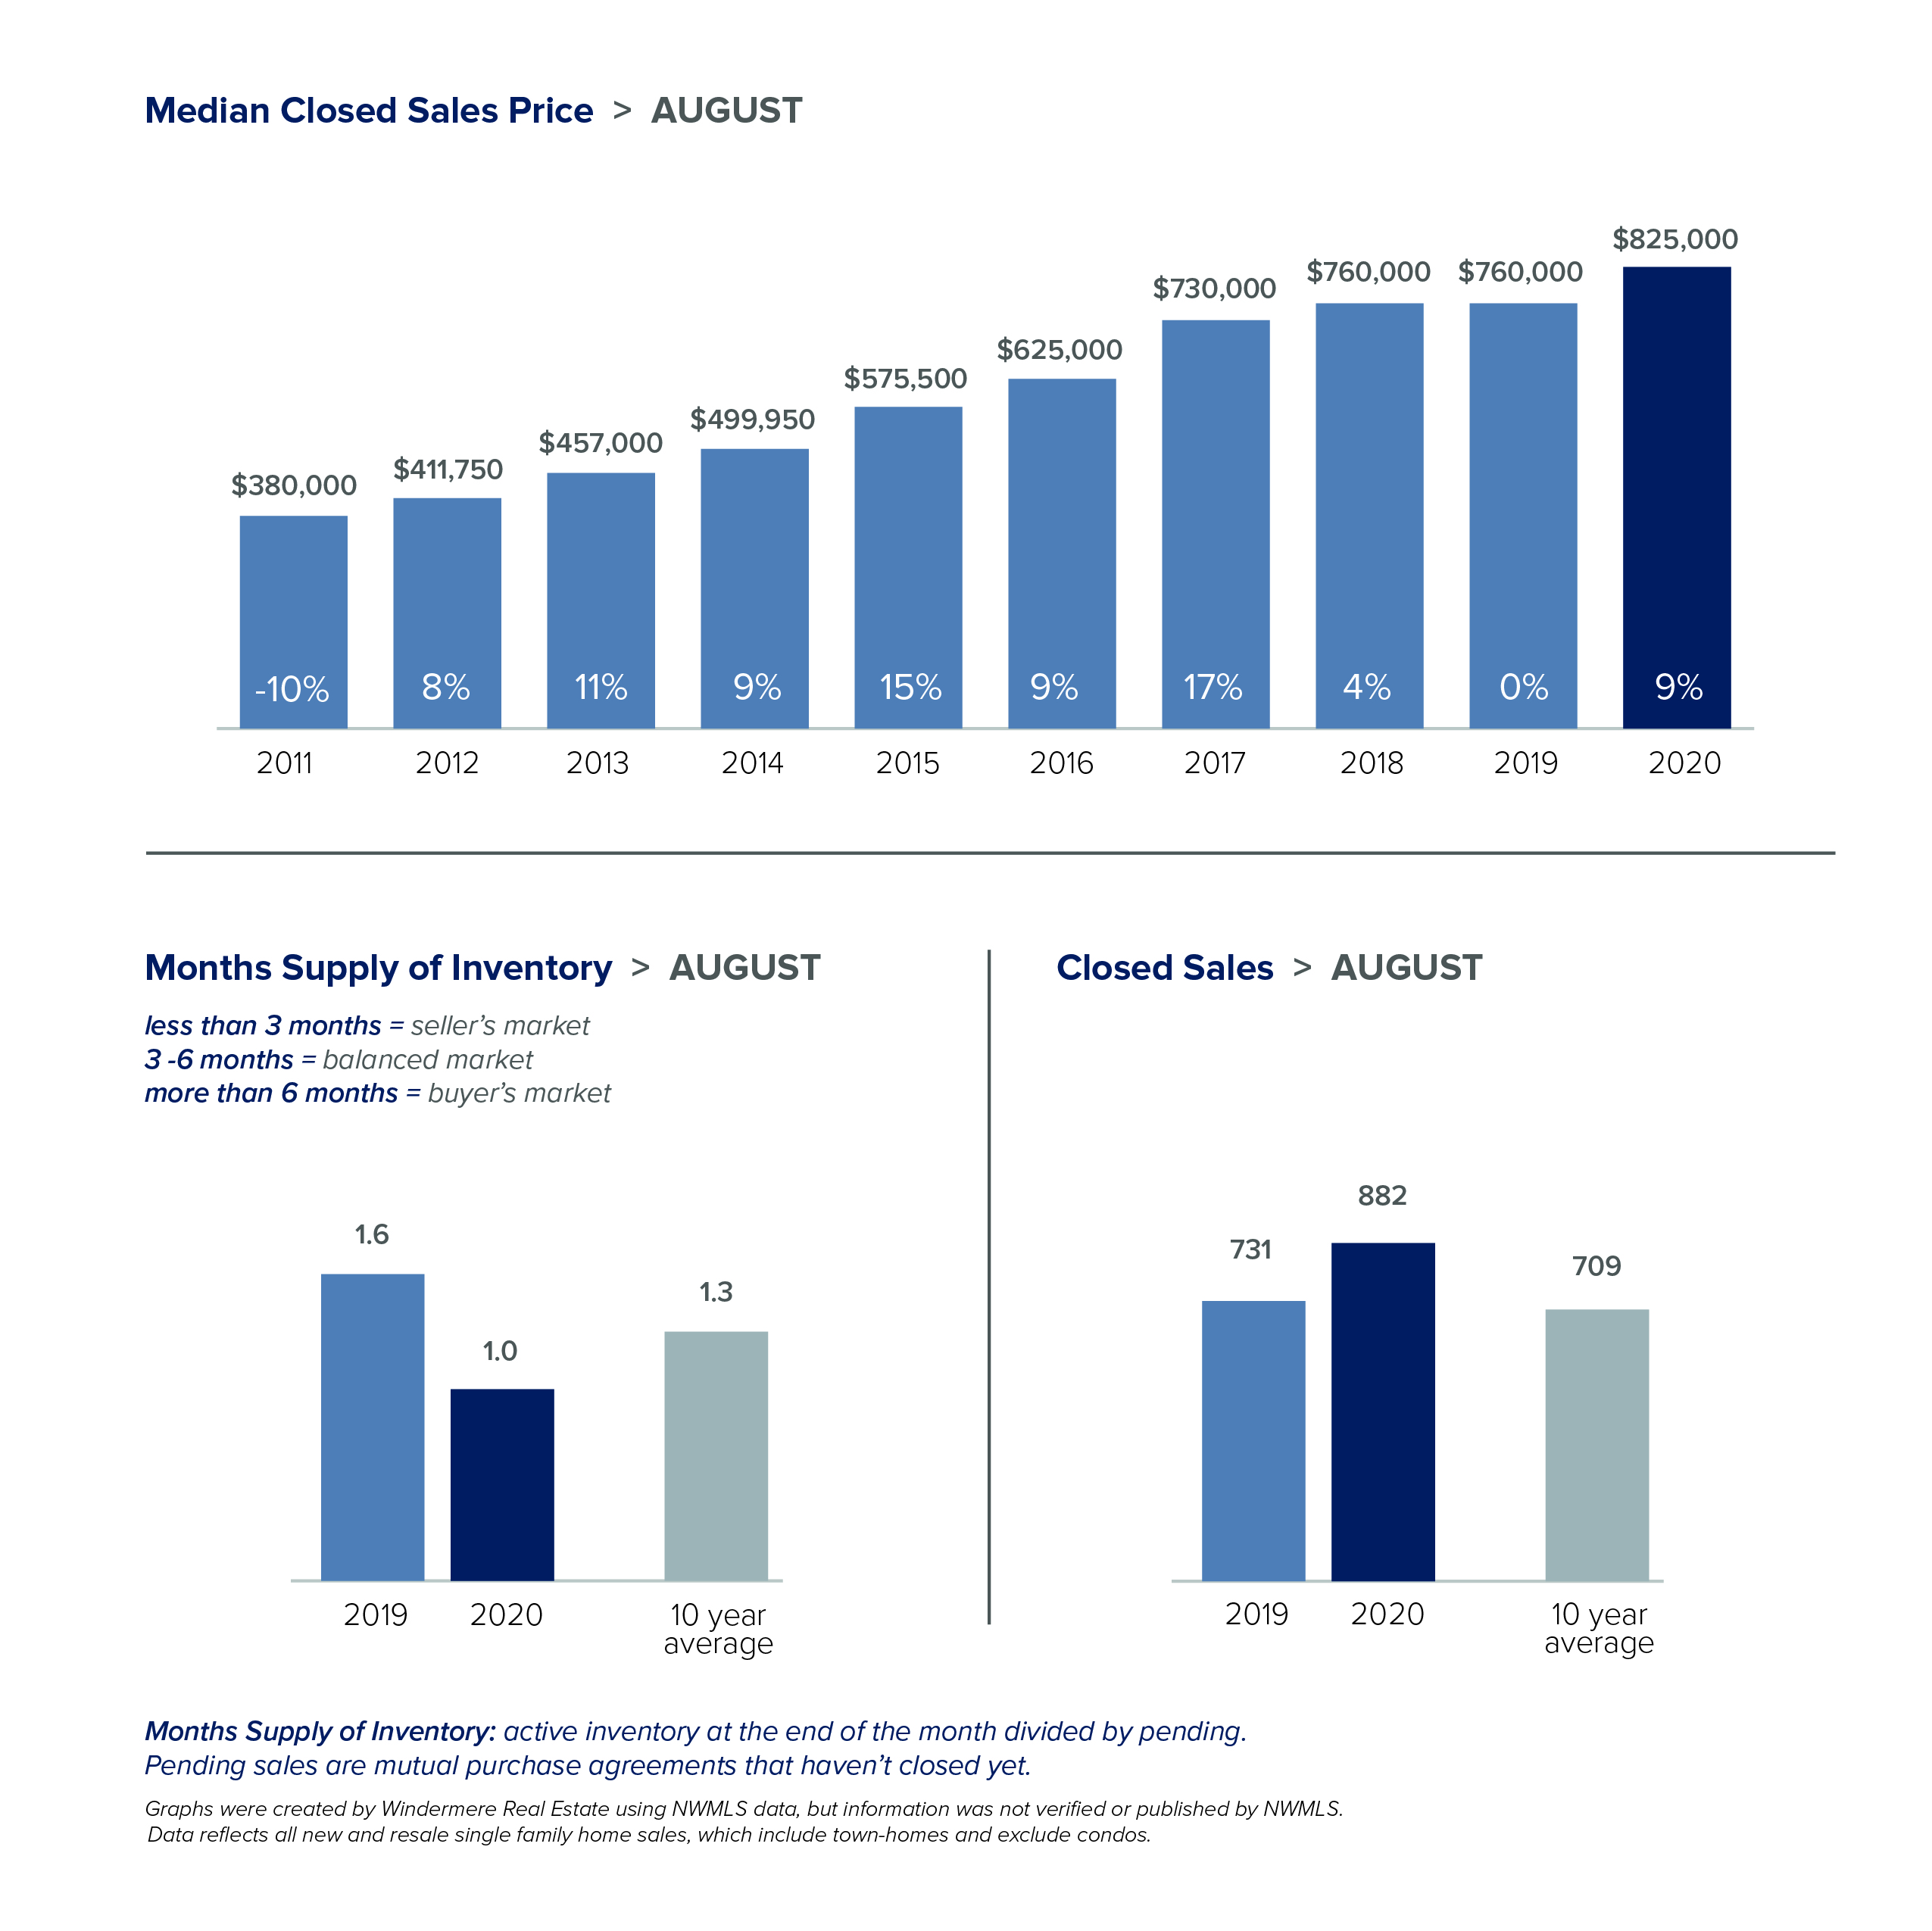
 August saw the lowest number of homes for sale in more than 20 years and the lowest mortgage rates on record. Sparse inventory and high demand pushed home prices to new highs.
EASTSIDE
KING COUNTY
SEATTLE
SNOHOMISH COUNTY
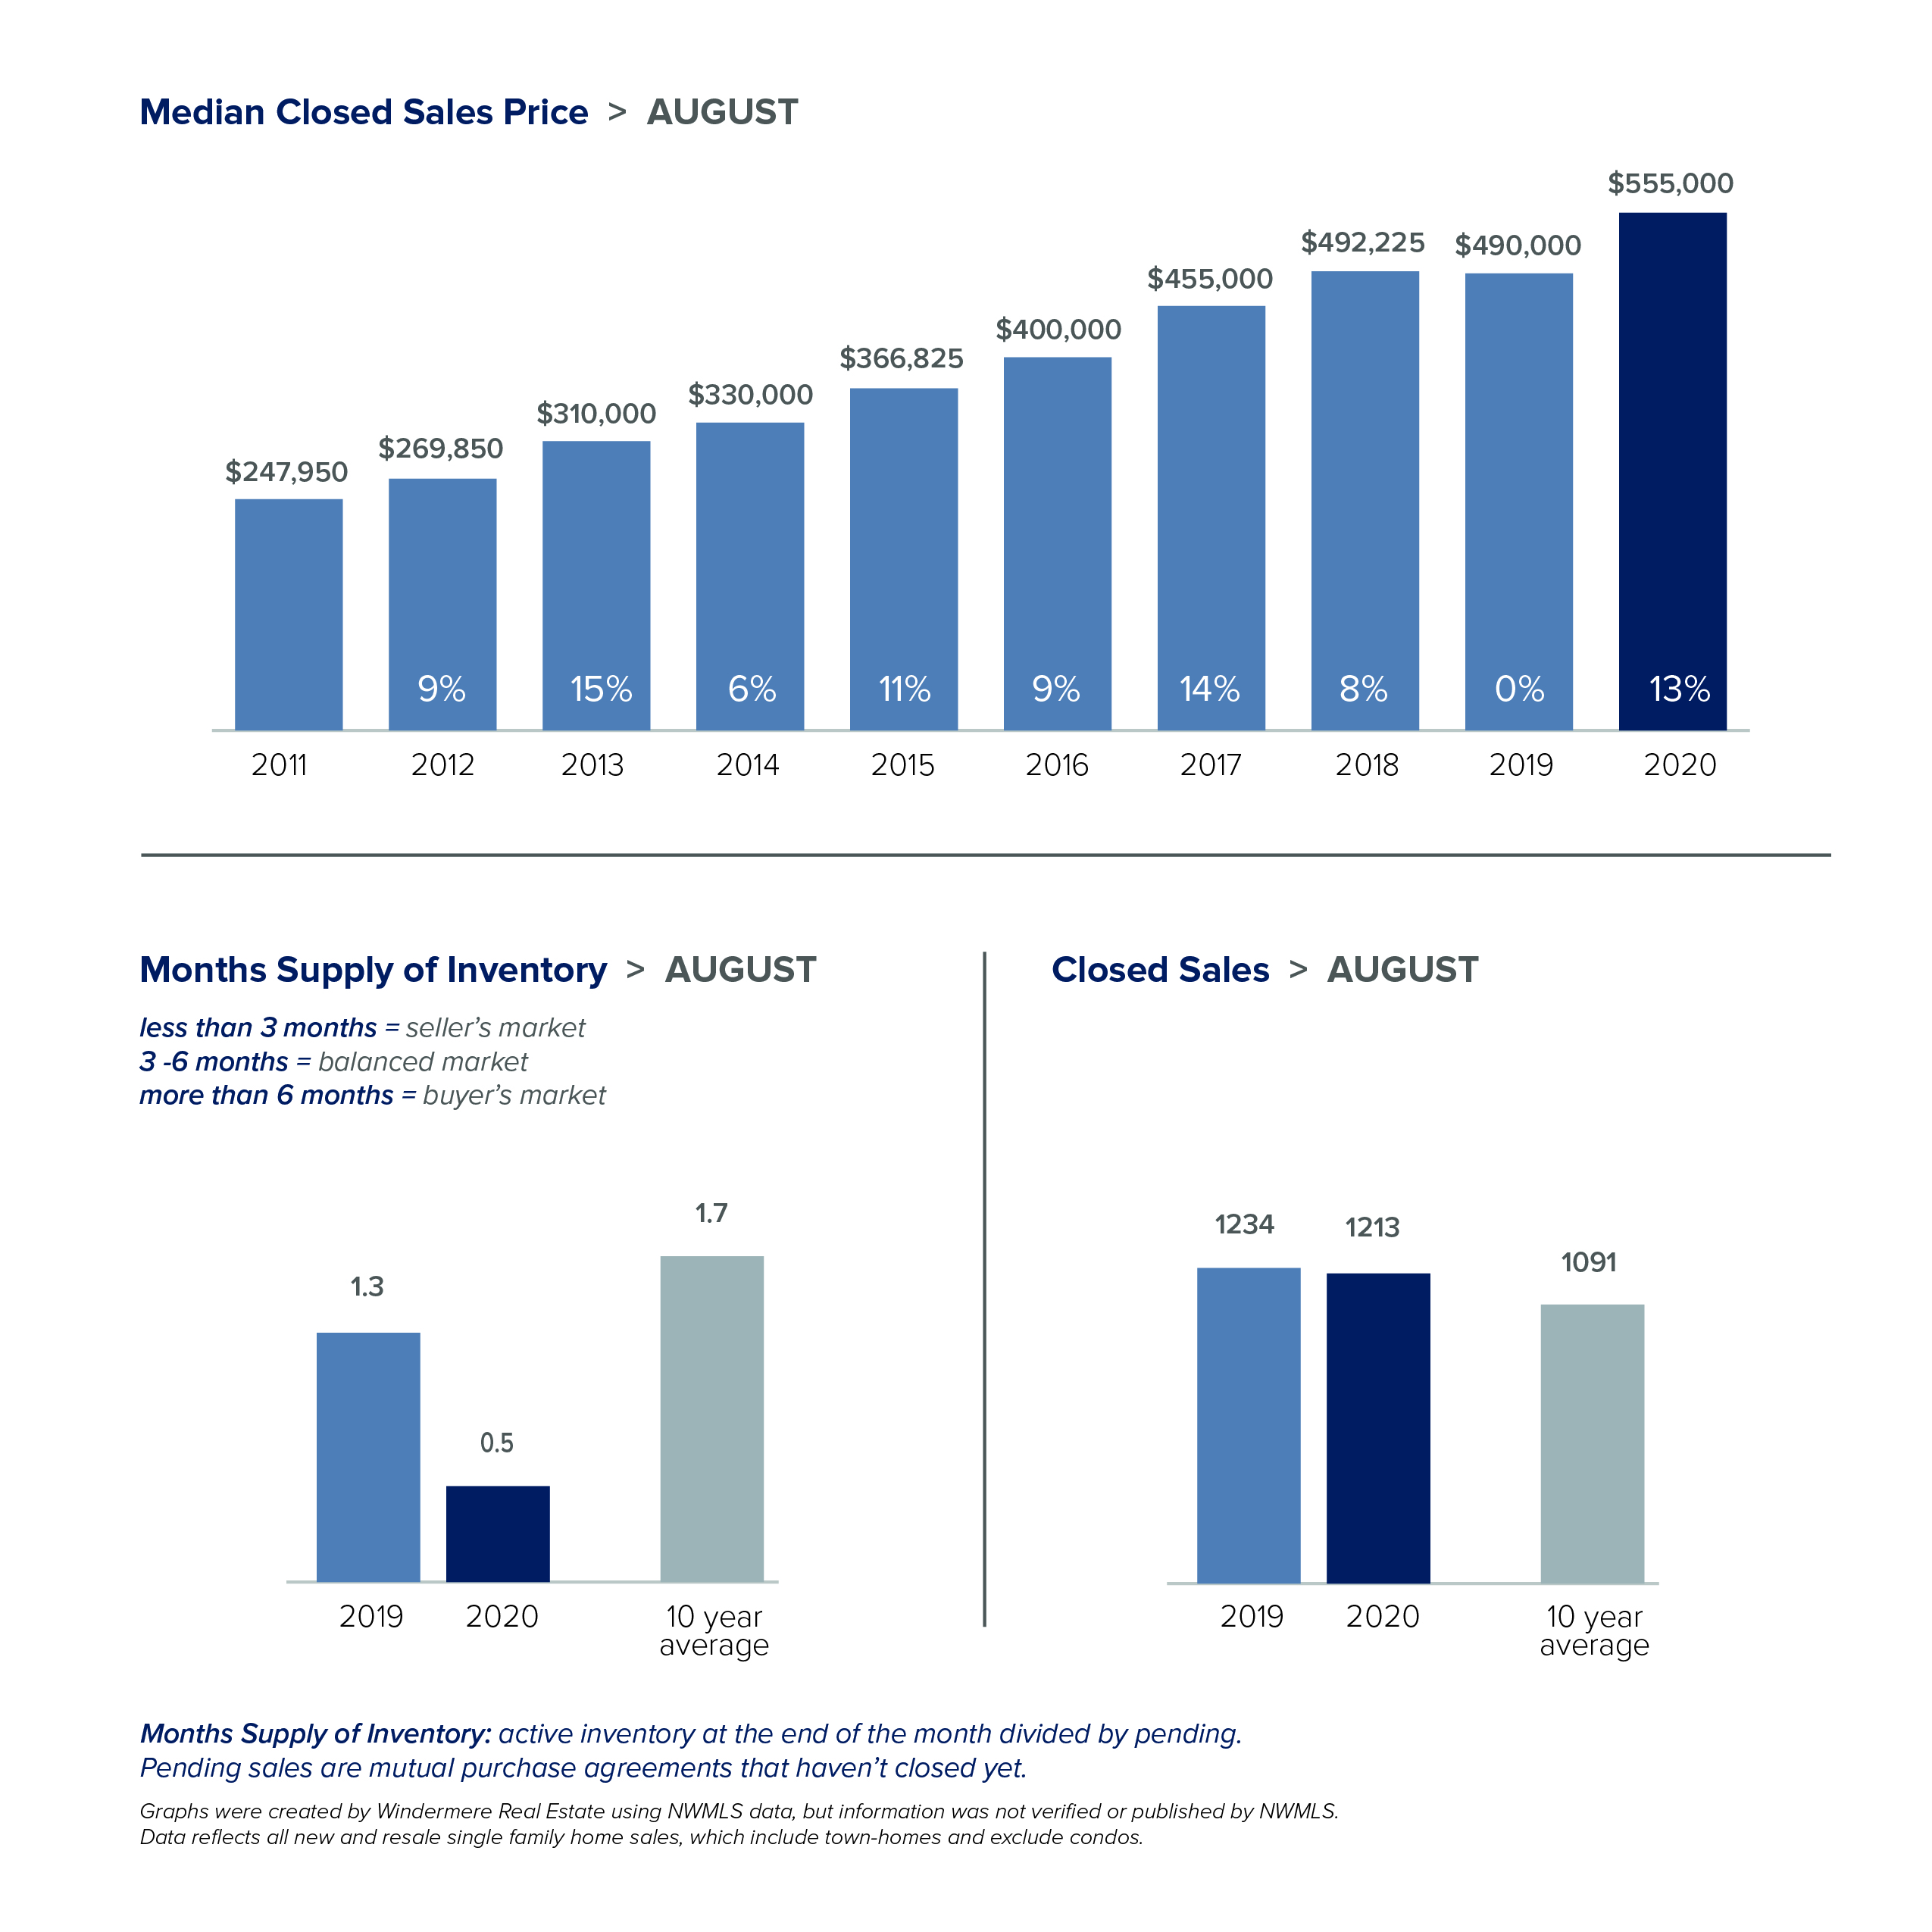
Local Market Update – August 2020
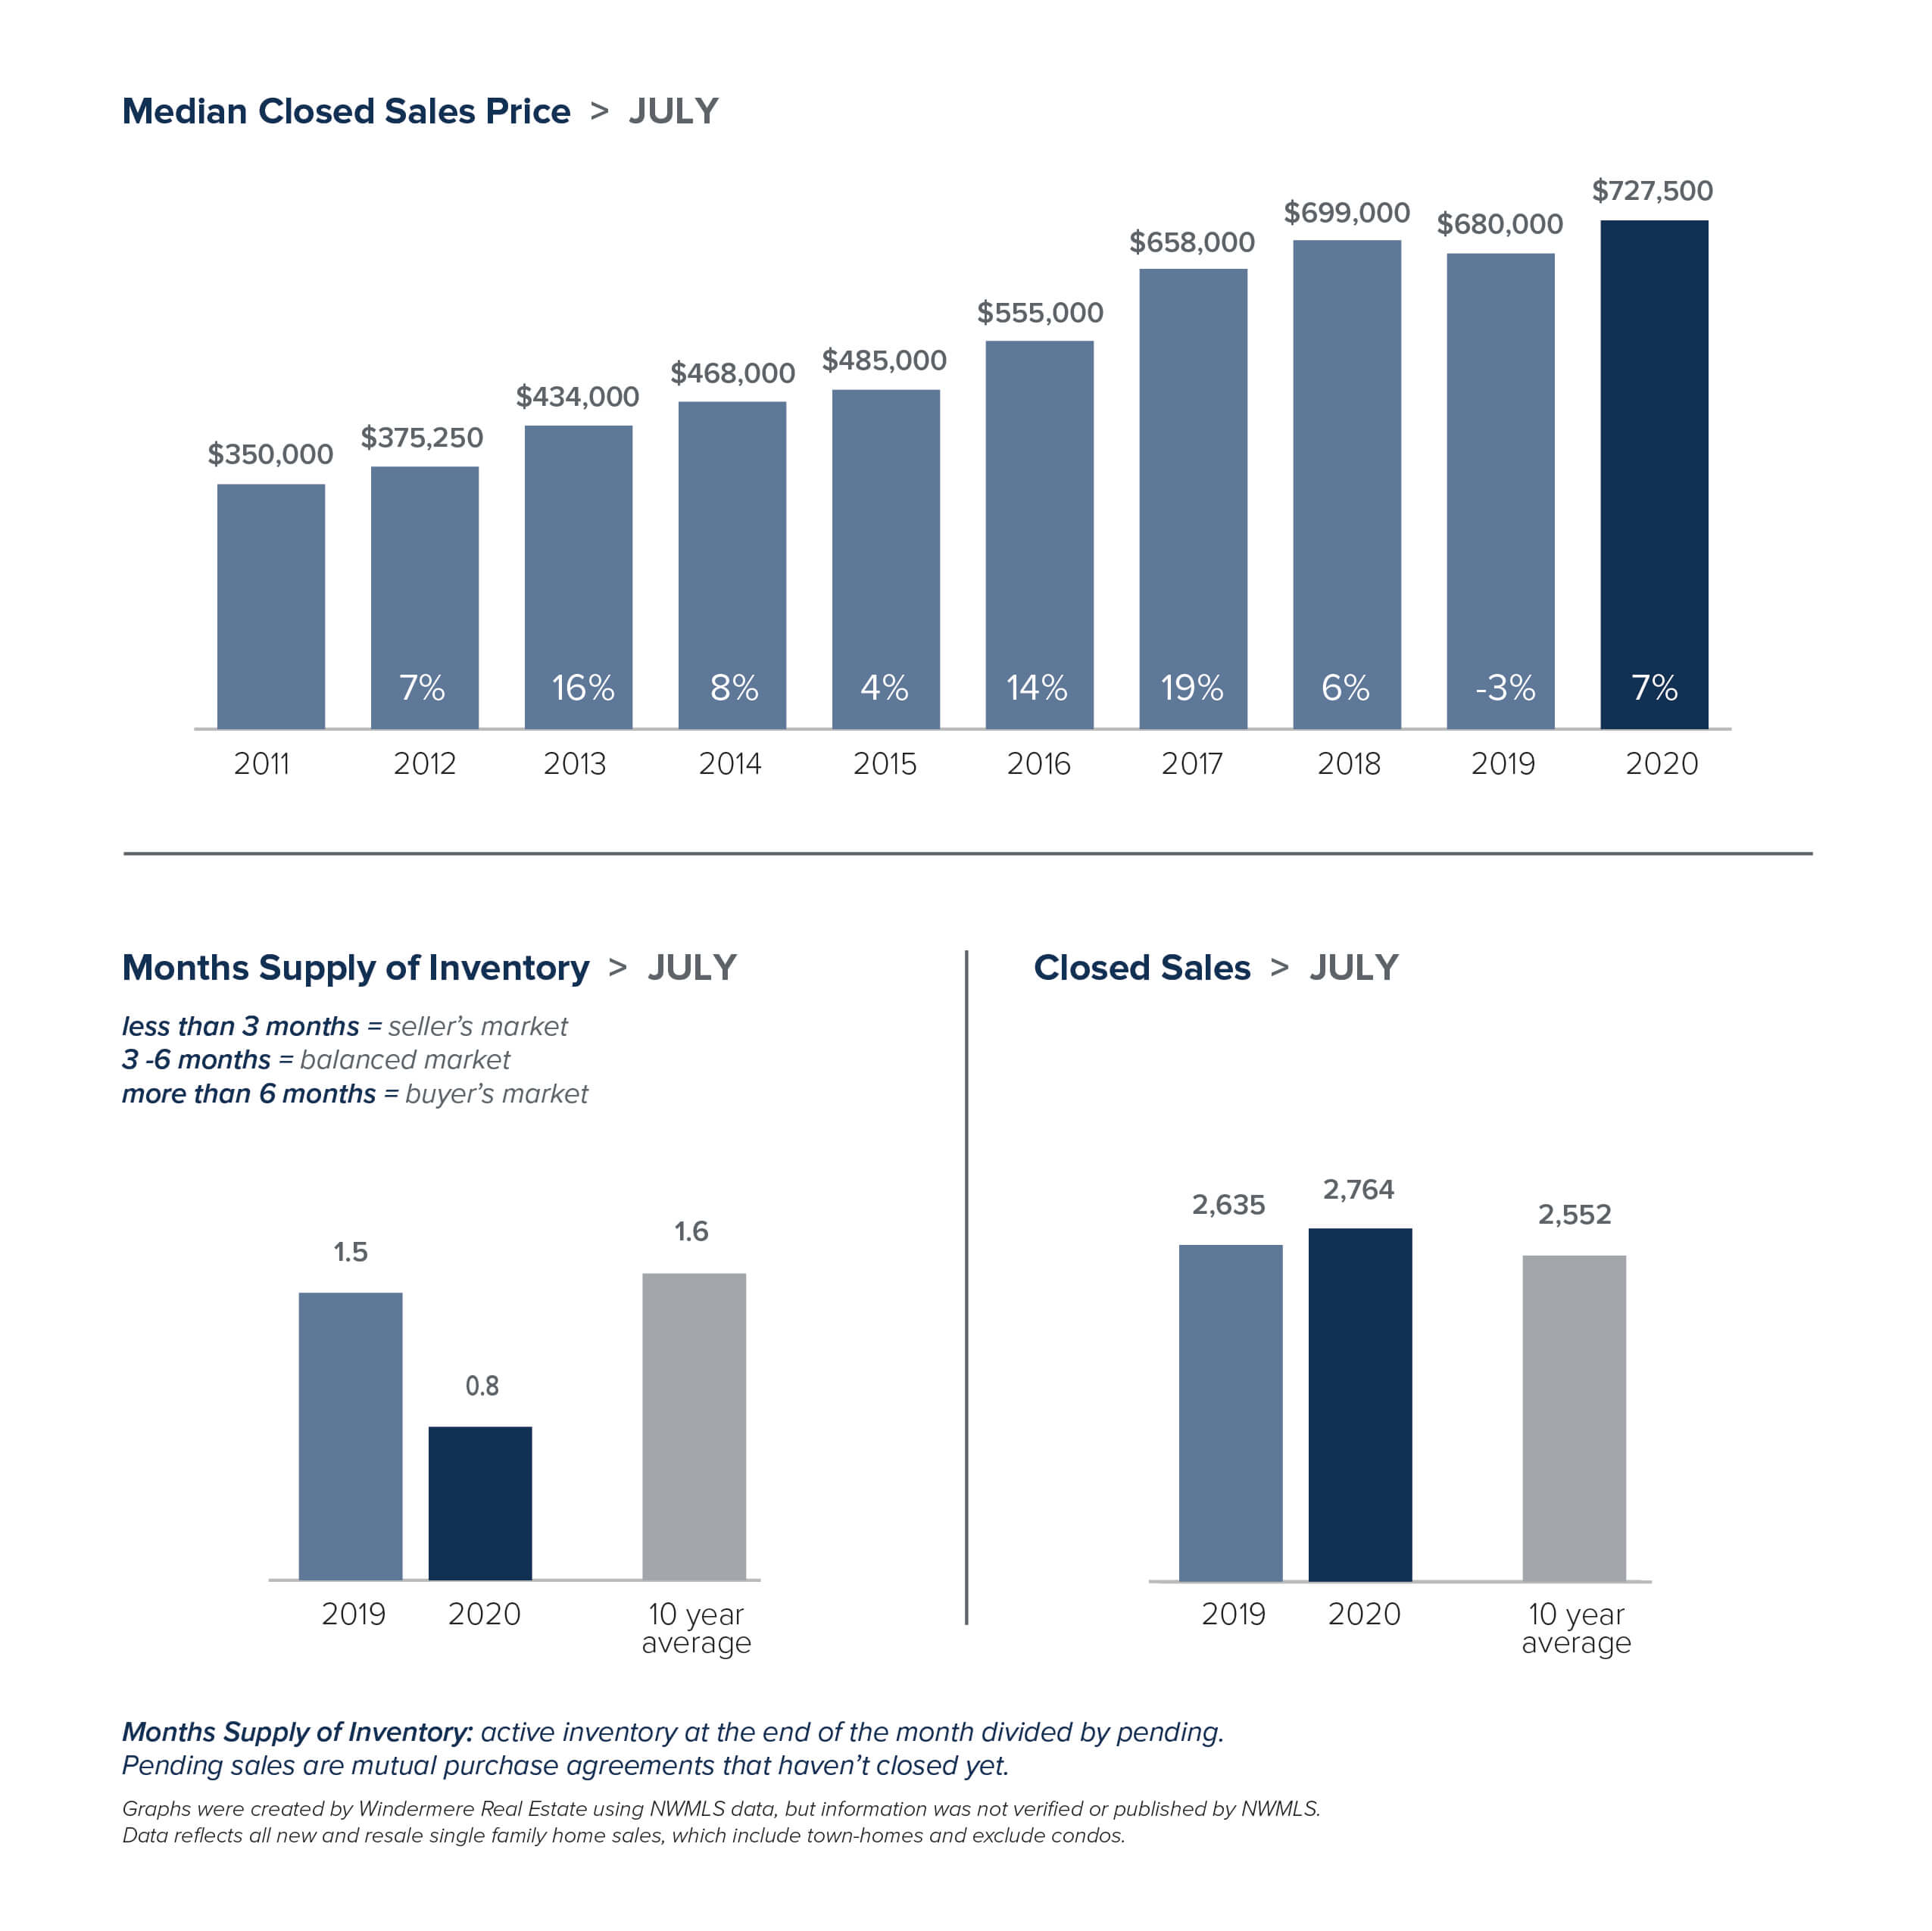
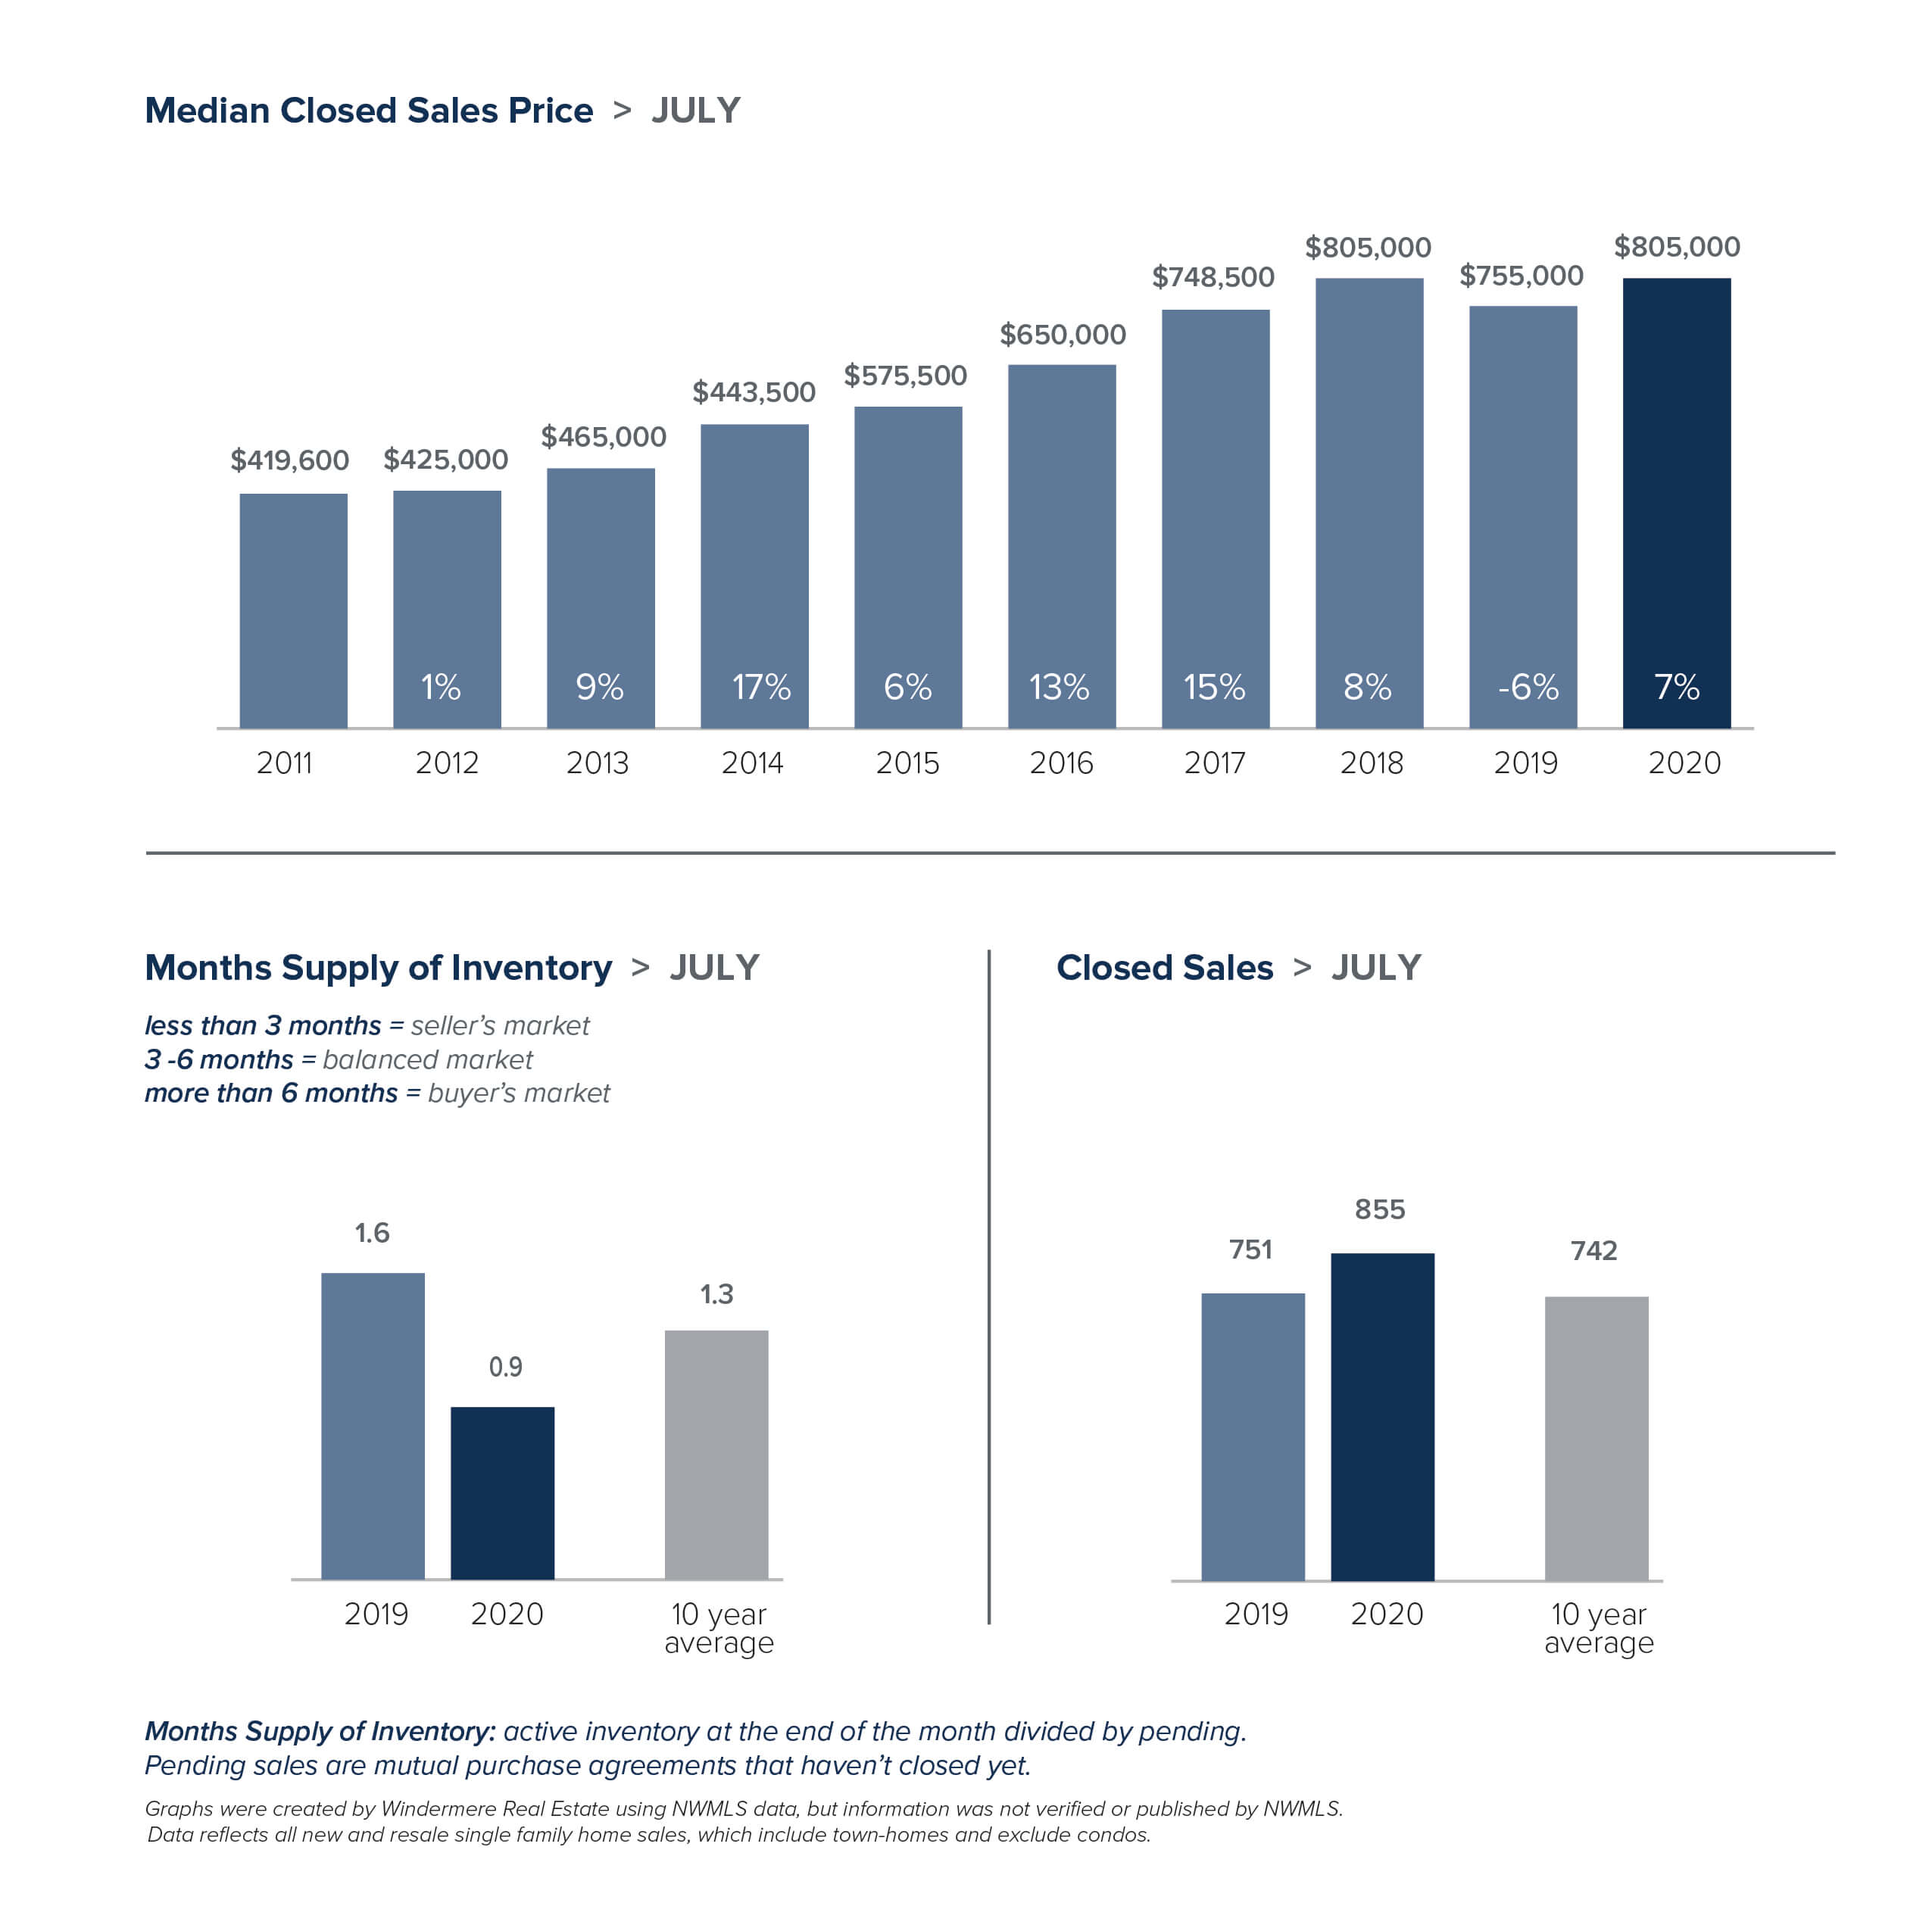
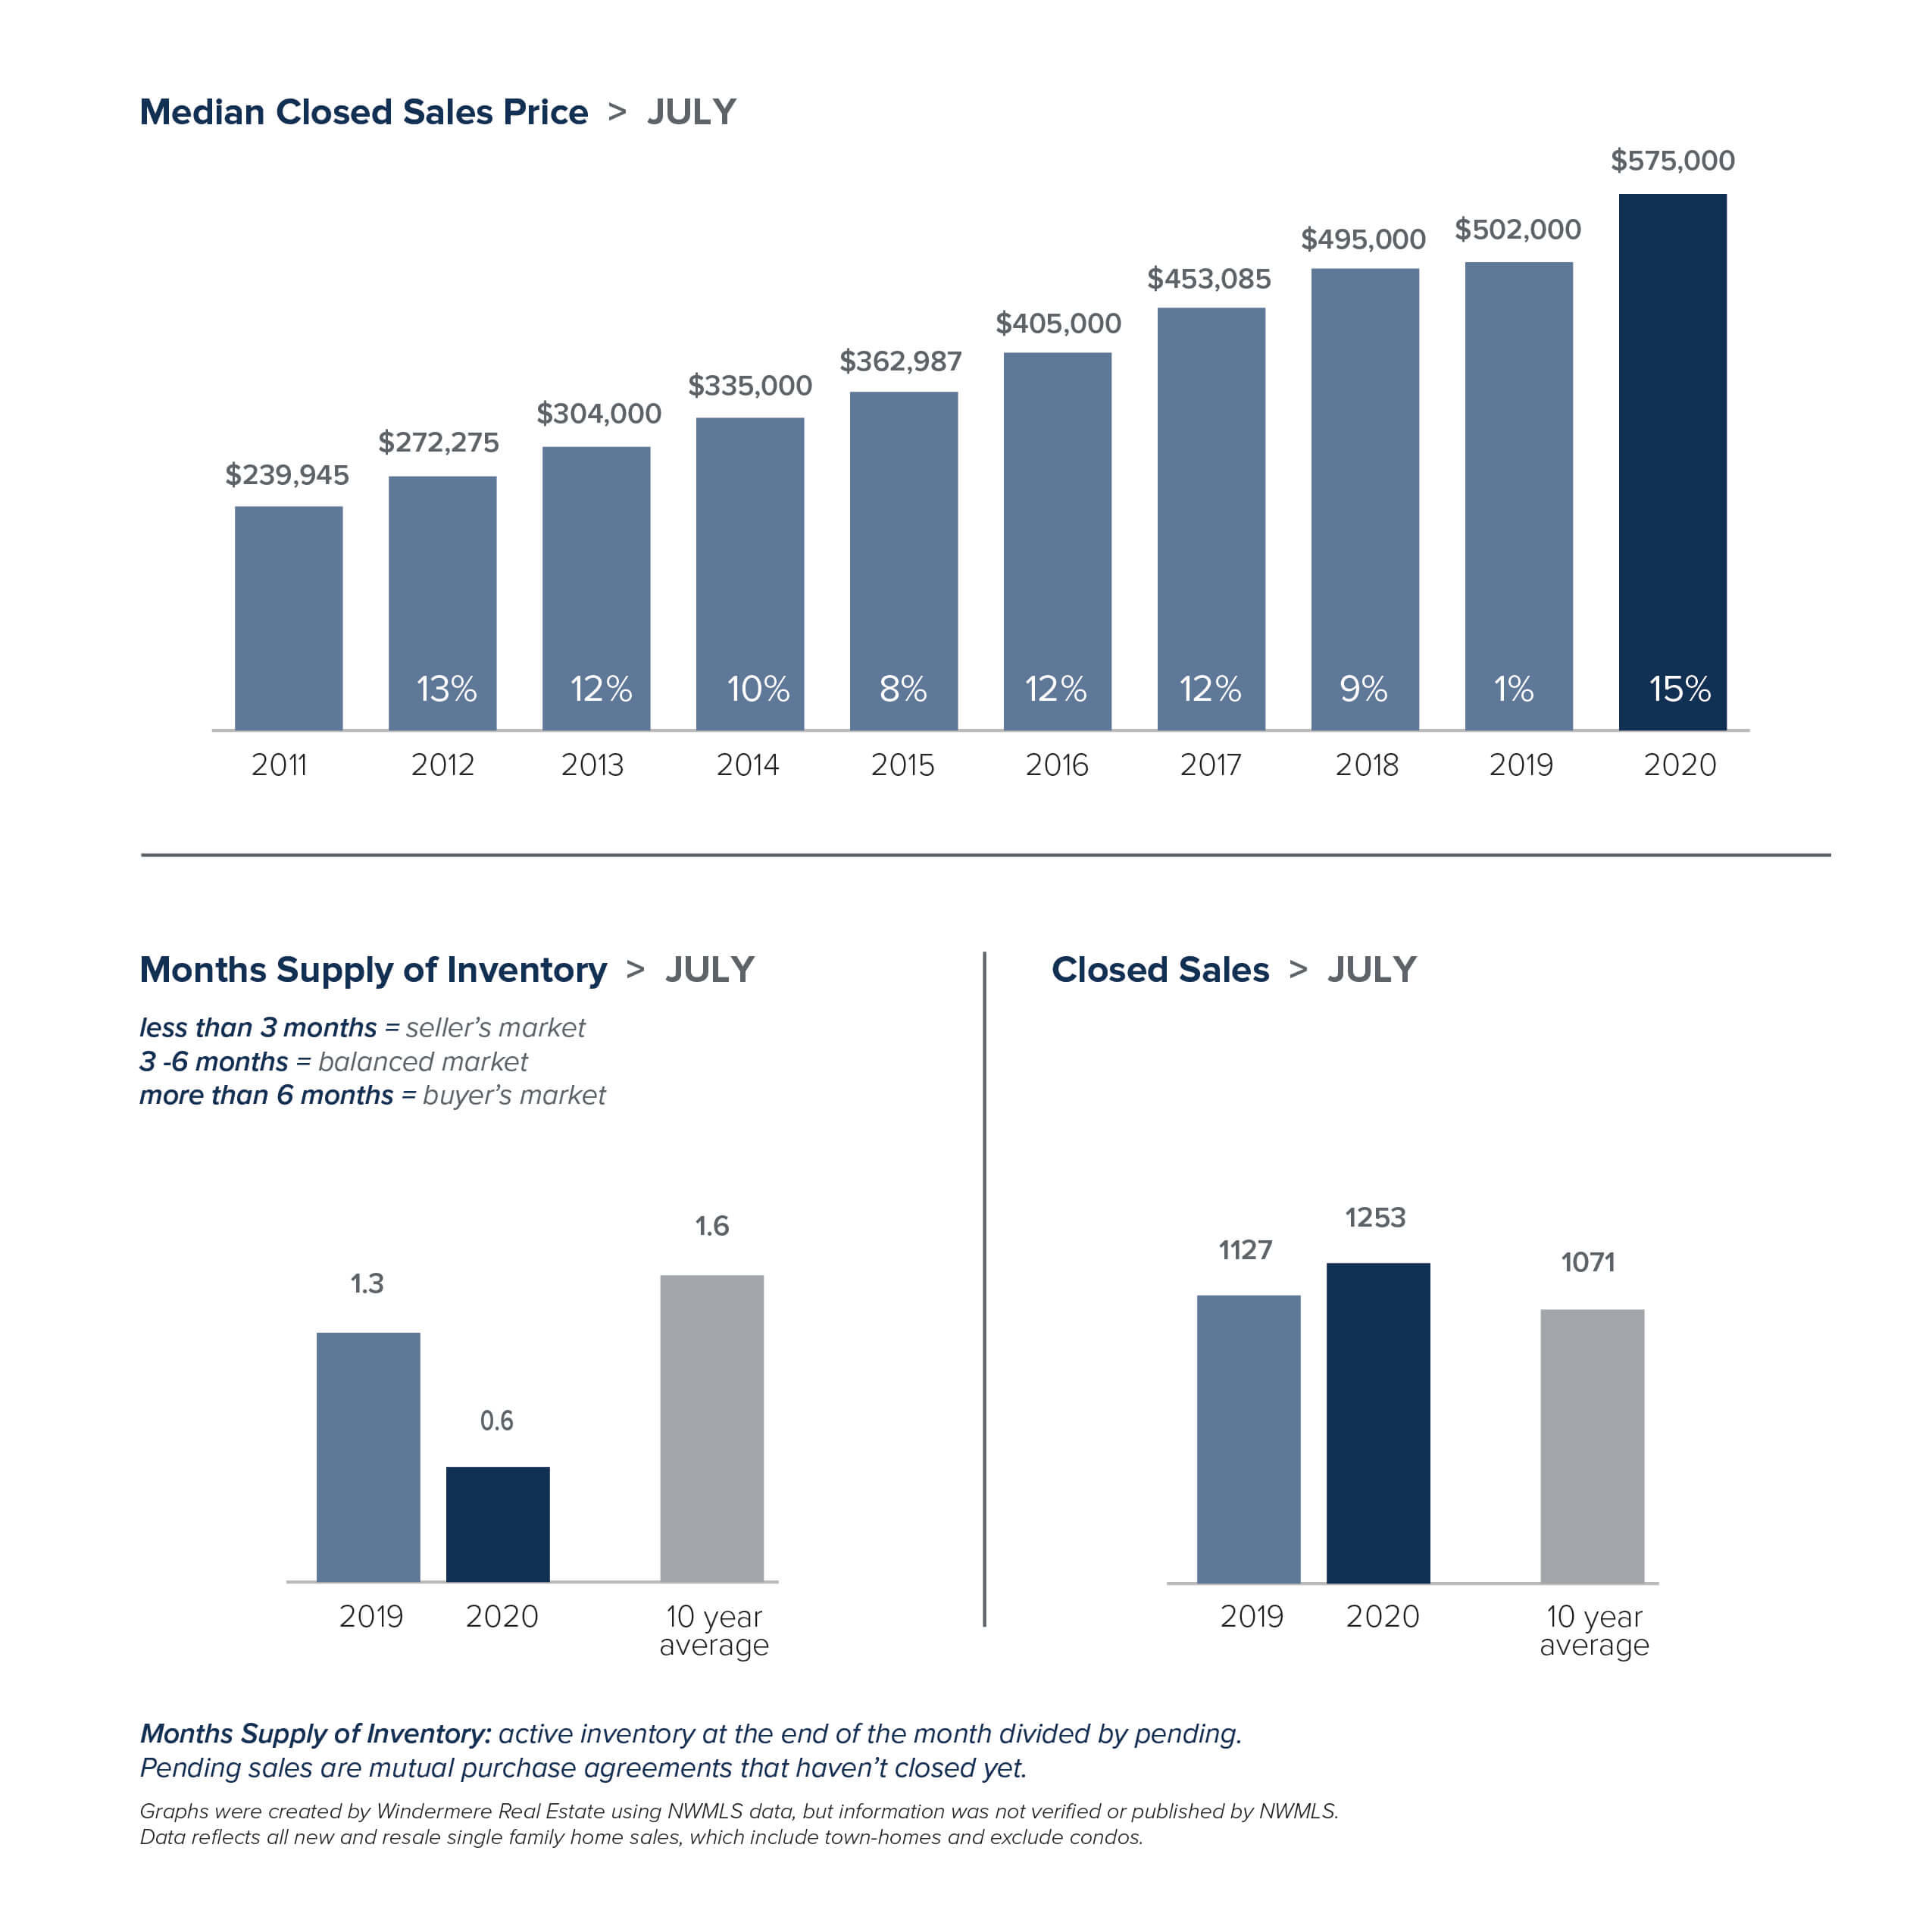
 While the pace of daily life may seem slow right now, the local real estate market has had an unusually busy summer. The number of new listings in July was up, sales increased, and home prices followed suit. • While overall inventory is at historic lows, more sellers put their homes on the market. New listings of single-family homes in King County jumped more than 25% from a year ago. Snohomish County saw a 7% increase in new listings. • Pent-up buyer demand fueled sales activity in July. The number of pending sales was up 17% over a year ago in King County, and up 13% in Snohomish County. • With buyers snapping up new listings as soon as they hit the market, total available inventory dropped to a 10-year low for the month. • The lack of inventory is benefiting sellers, and multiple offers are now common at every price point. As a result, single-family home prices rose 7% in King County and 15% in Snohomish County. The charts below provide a brief overview of market activity. If you are interested in more information, every Monday Windermere Chief Economist Matthew Gardner provides an update regarding the impact of COVID-19 on the US economy and housing market. You can get Matthew’s latest update here.
EASTSIDE
KING COUNTY
SEATTLE
SNOHOMISH COUNTY
VIEW FULL SNOHOMISH COUNTY REPORT
This post originally appeared on GetTheWReport.com
Local Market Update – July 2020
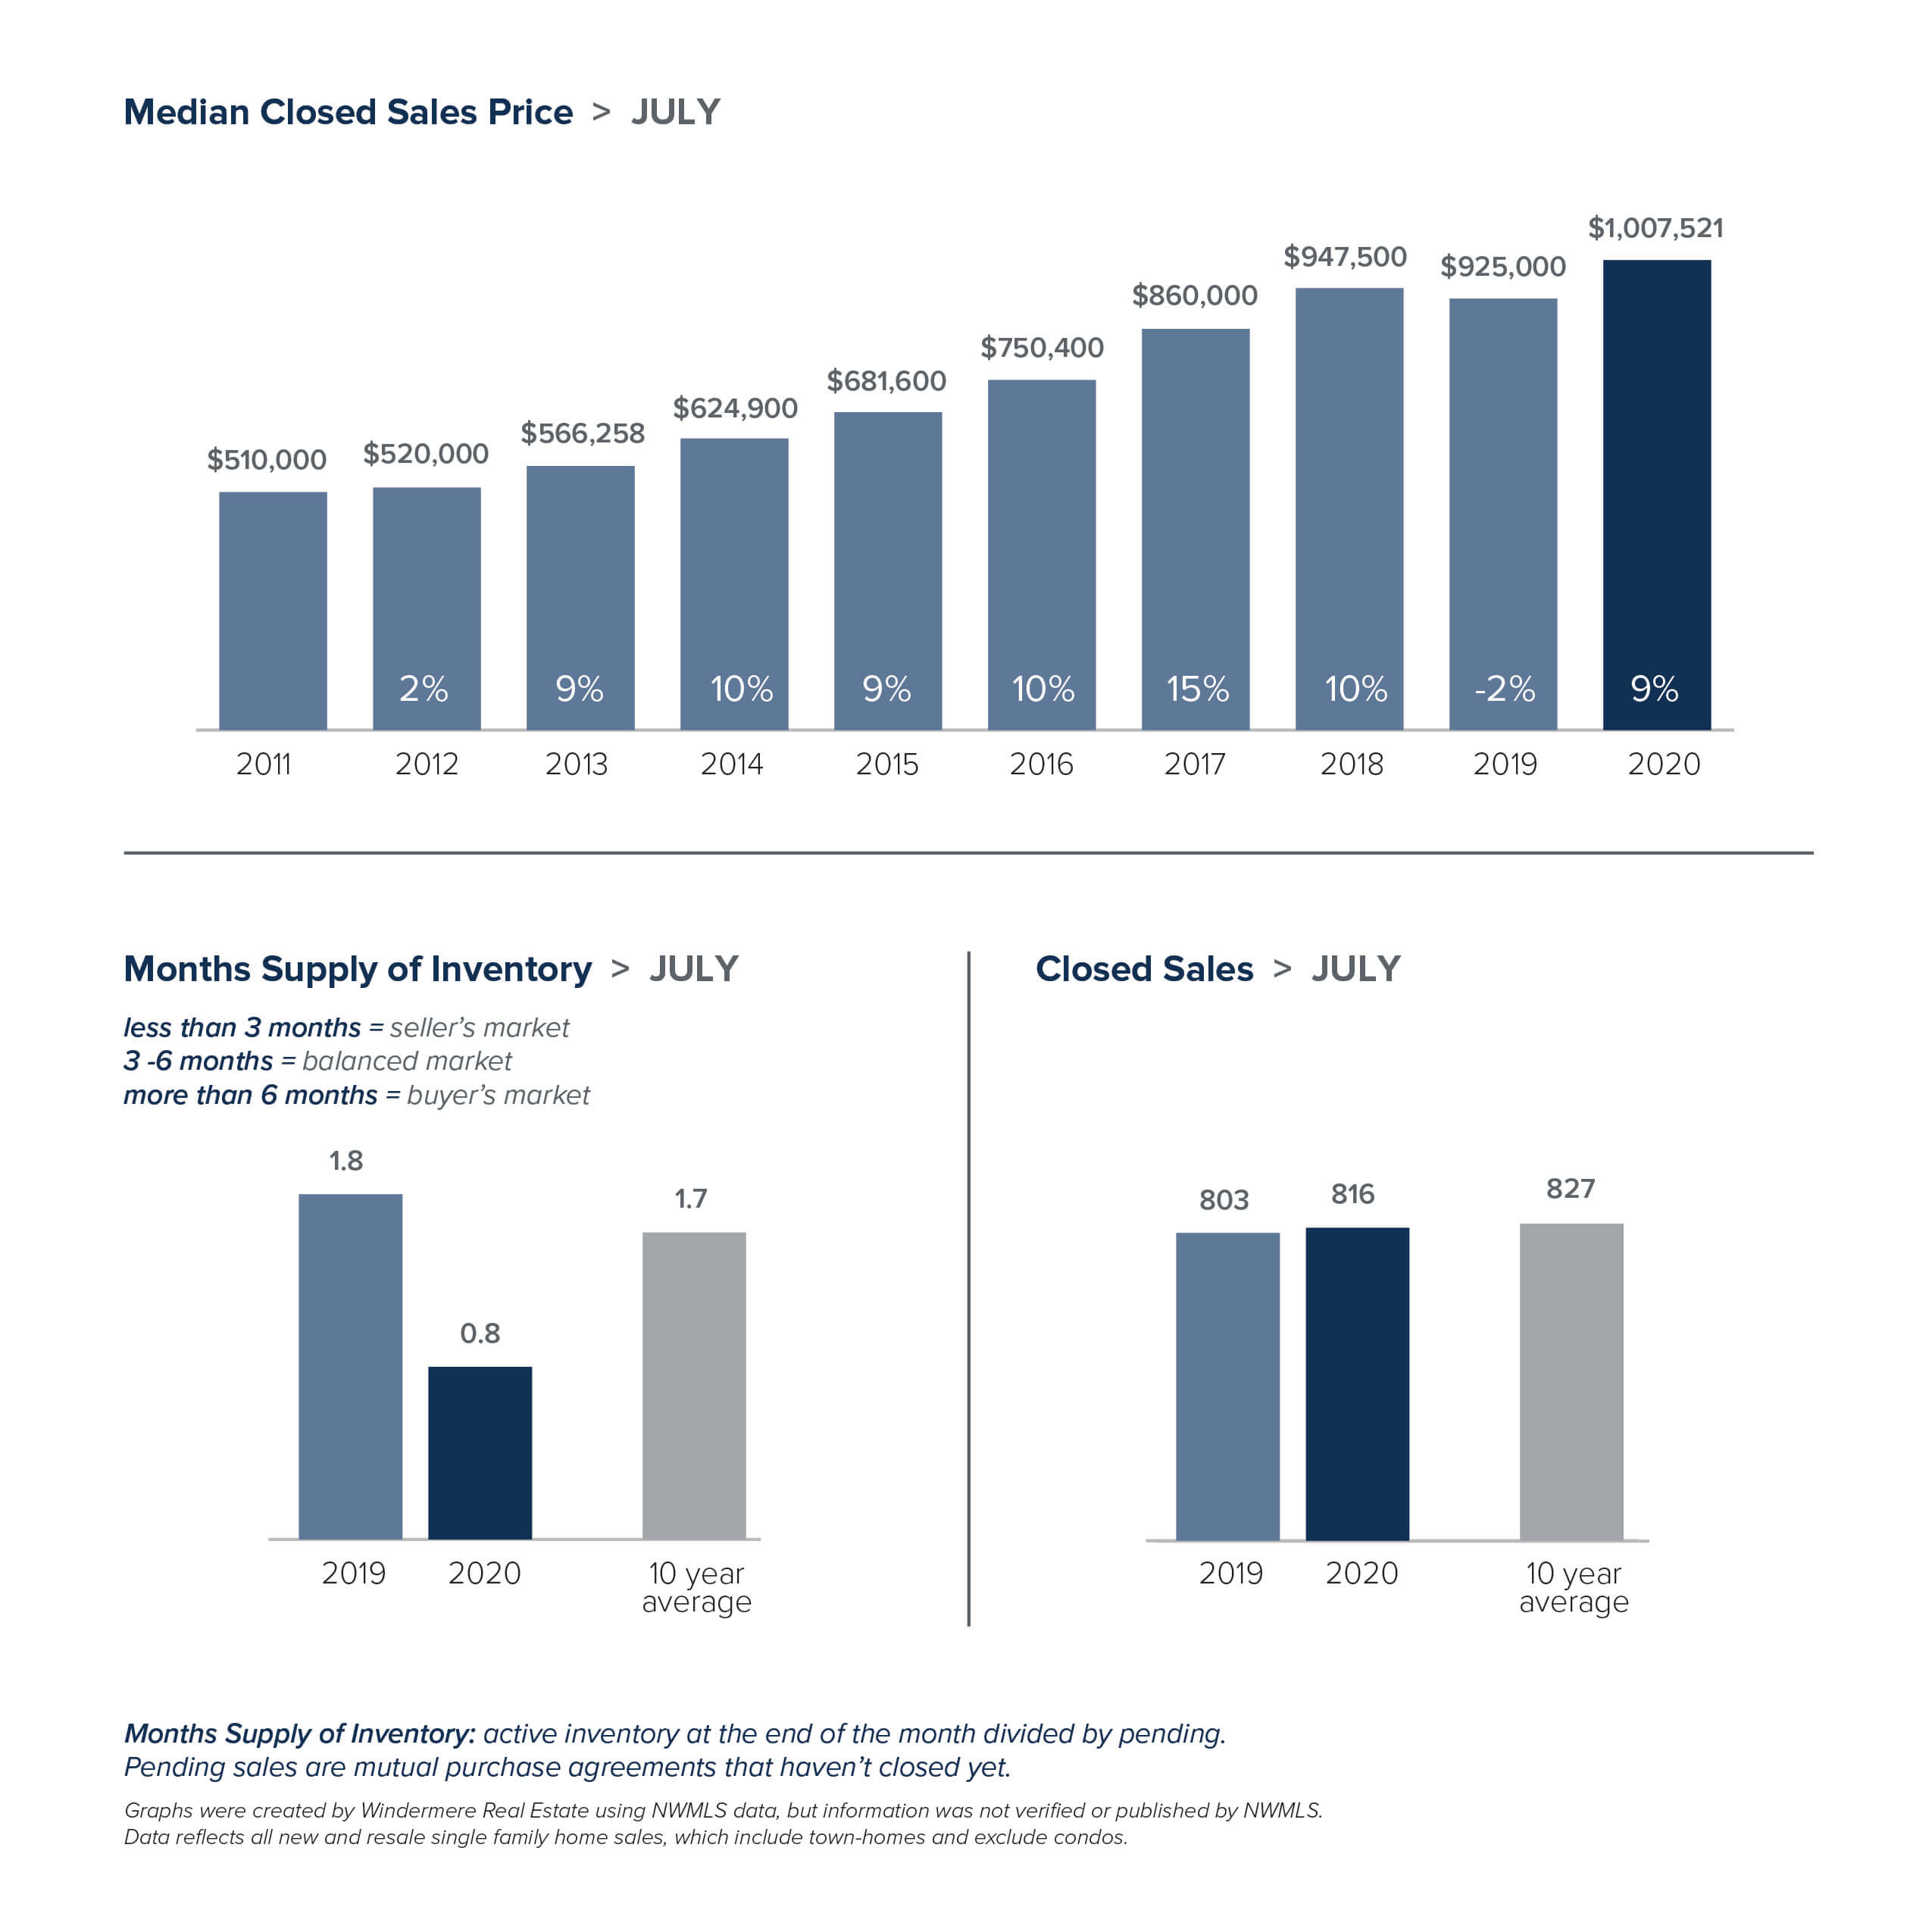
 While our lives are very different than they were a year ago, the local real estate market has recovered to 2019 levels. Record low interest rates are helping spur demand. Sales were up, home prices increased and multiple offers were common.
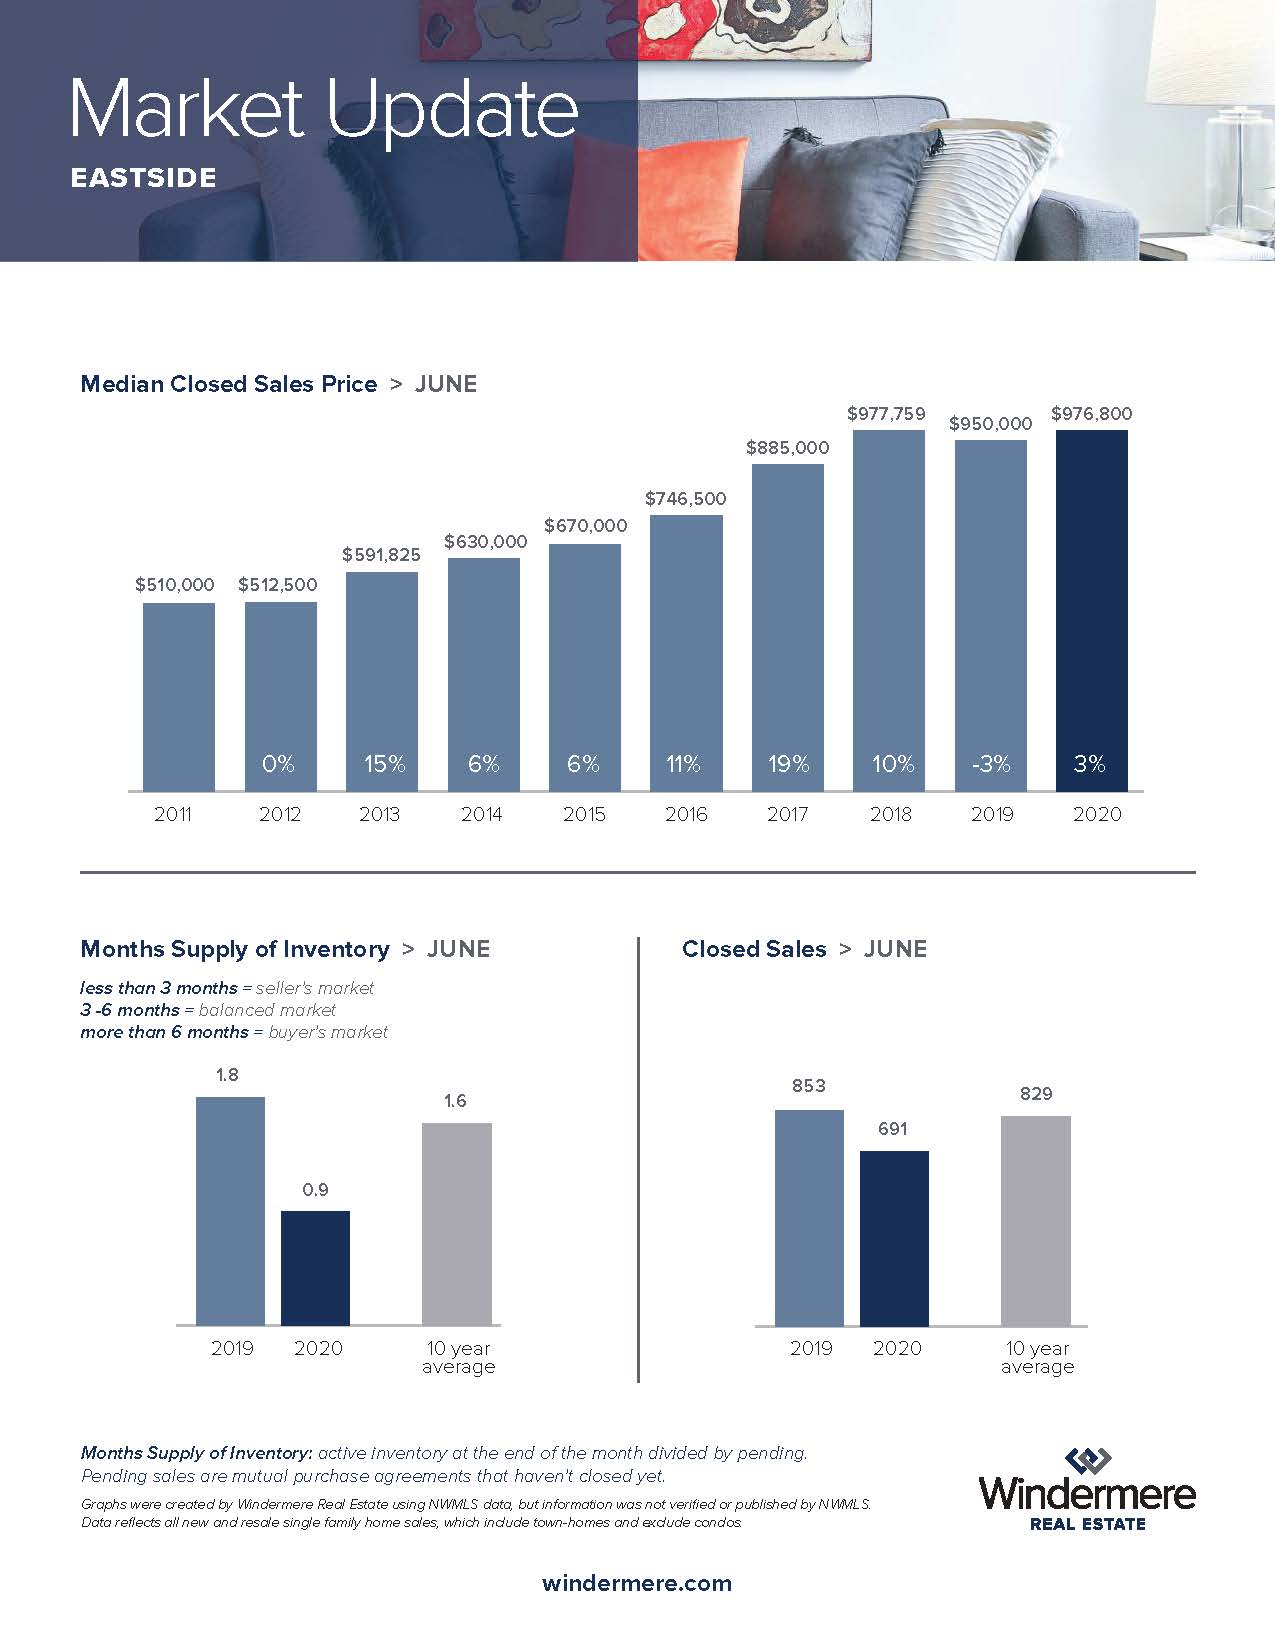
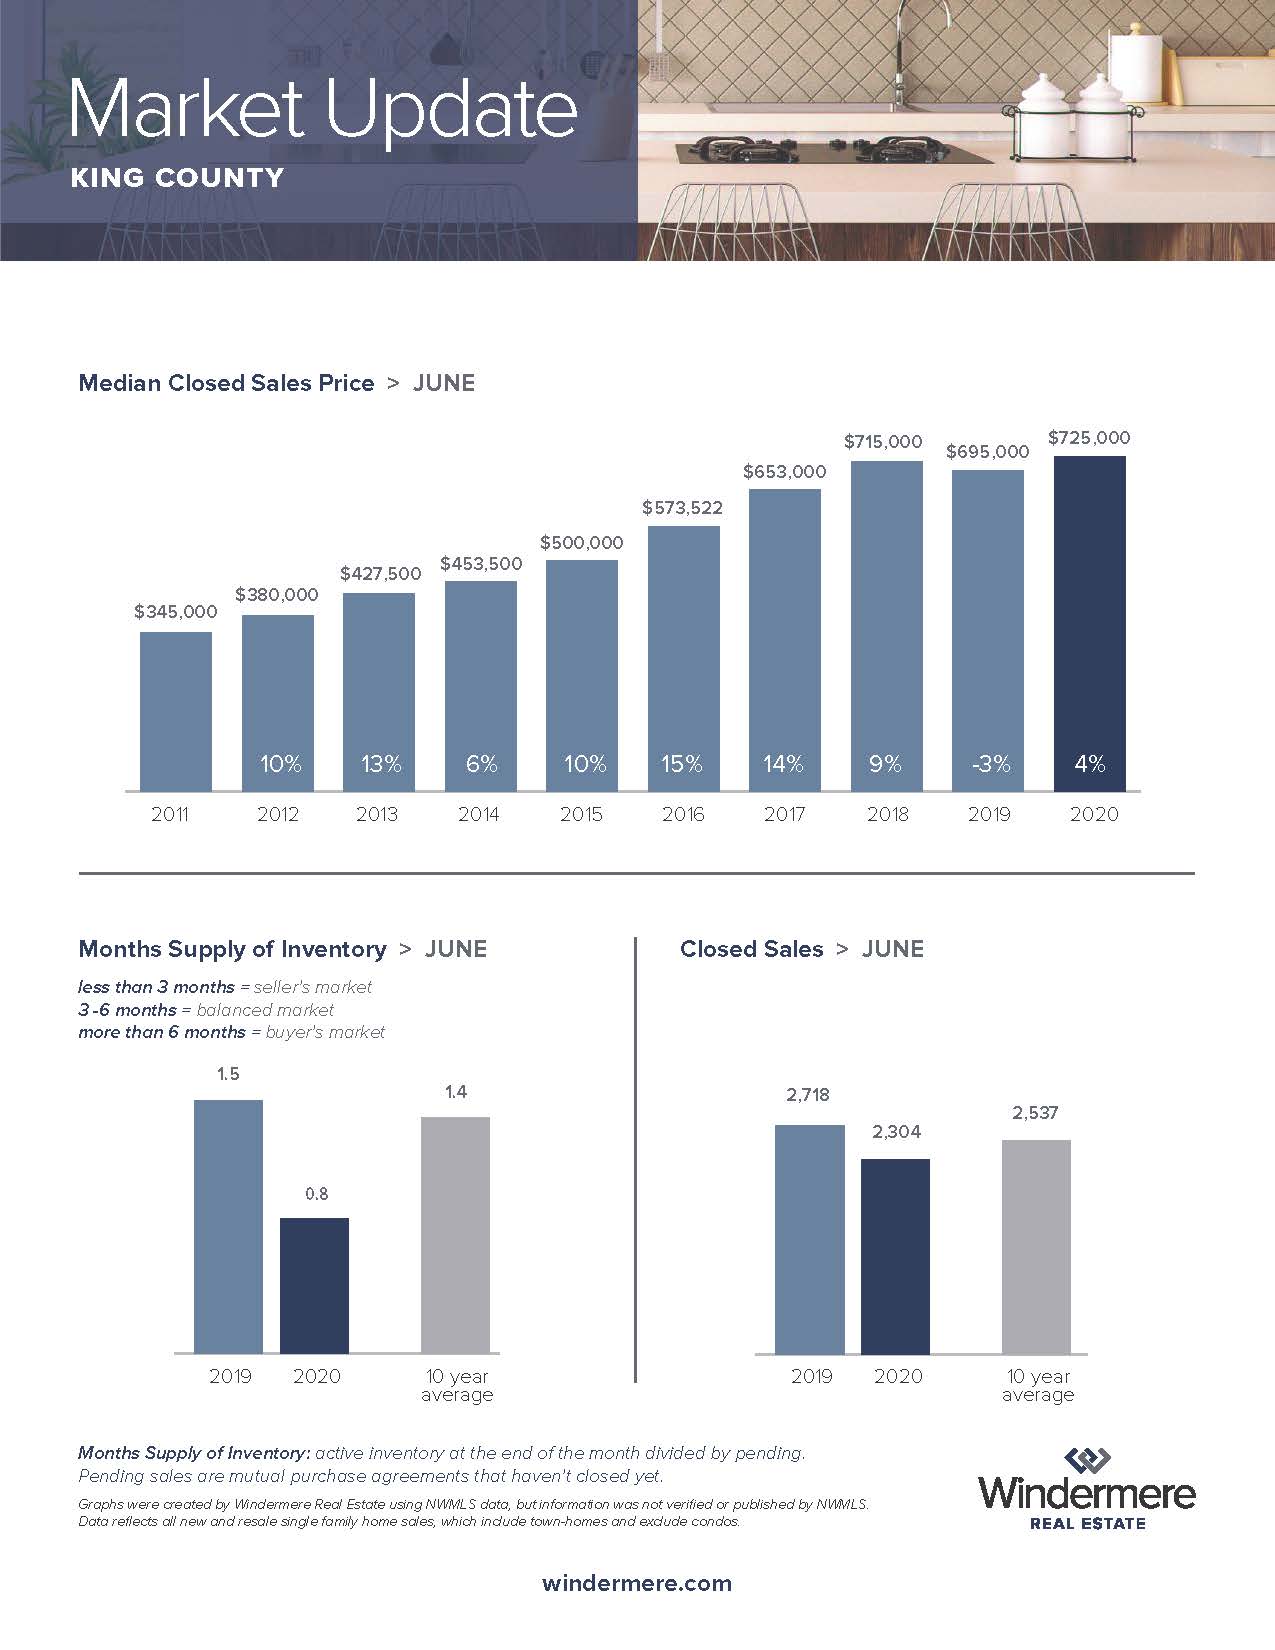
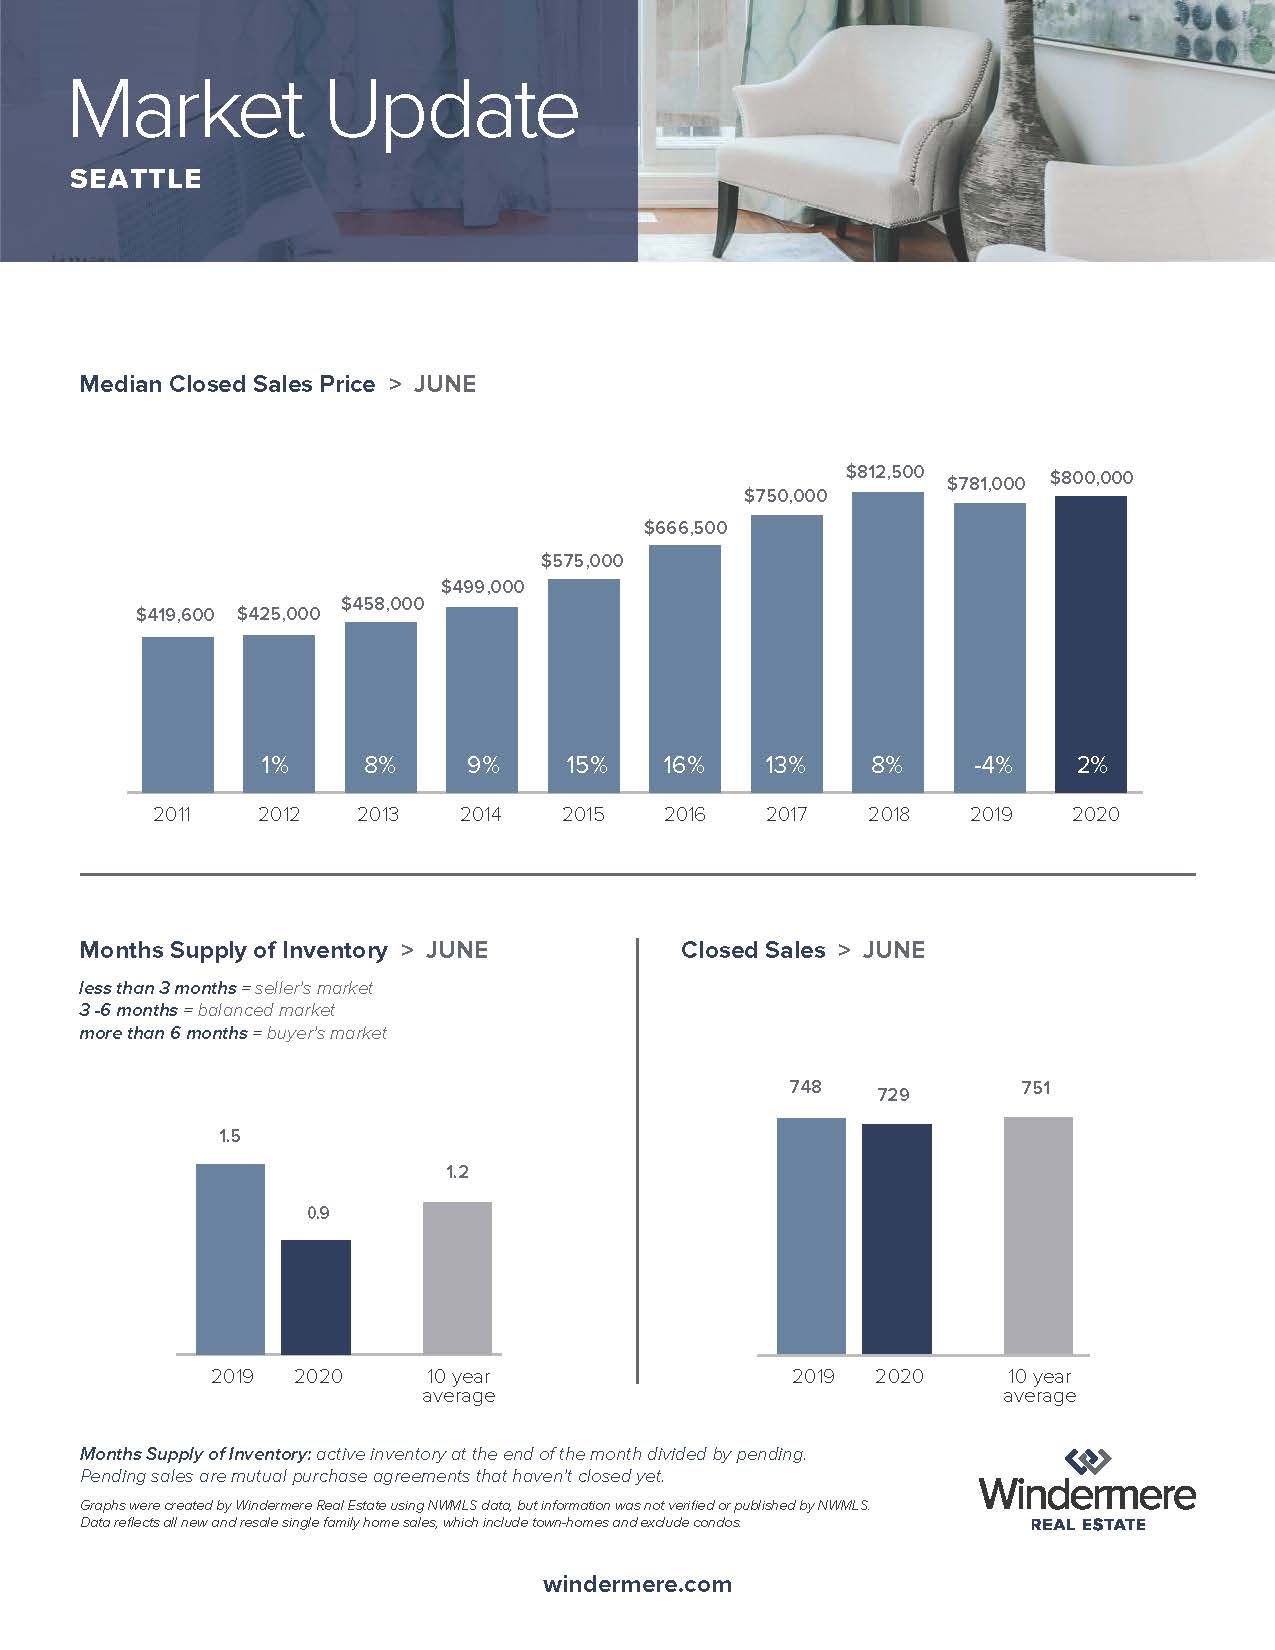
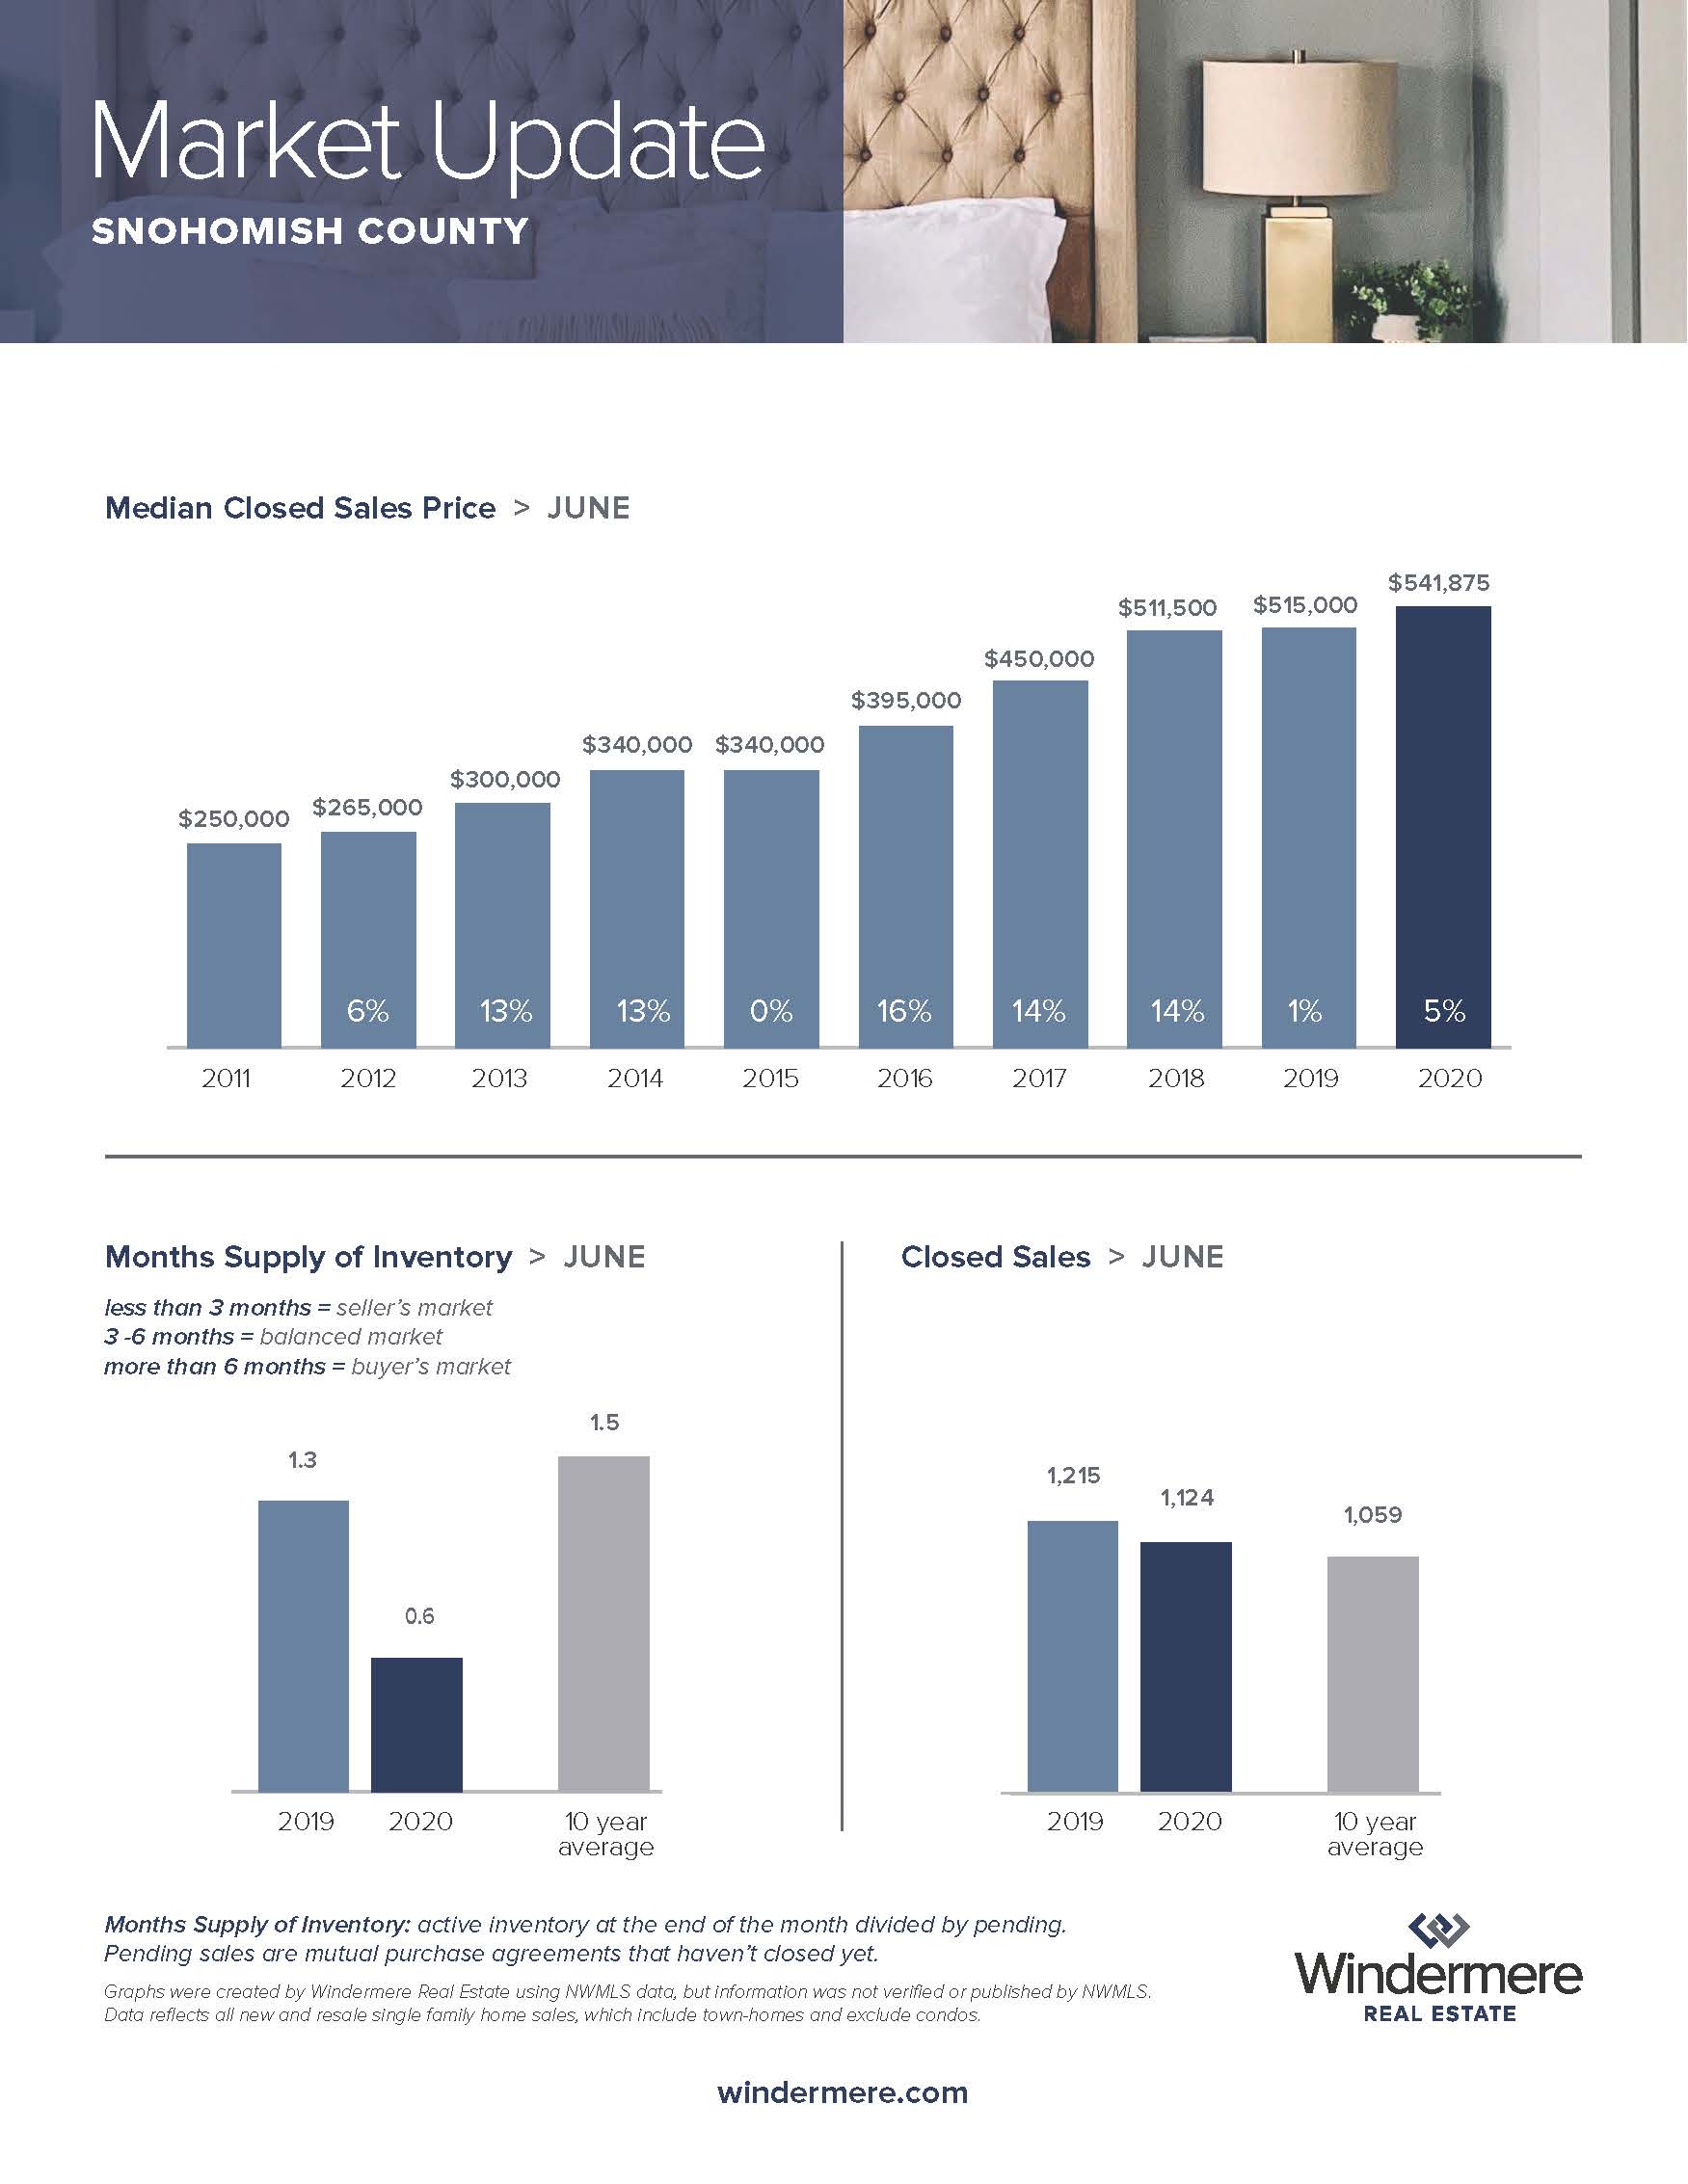
- The number of pending sales, a measure of current demand, was higher in June than for the same period a year ago.
- The supply of homes on the market remains very low, with just a month of available inventory. When inventory is this low, quick sales over full price are common. That was the case in June when about 40% of homes sold for more than the asking price.
- Home prices in King County rose 4% over a year ago. Snohomish County home prices increased 5%.
- More sellers put their homes on the market. While total inventory remains low, the number of new listings in June was similar to the same time last year.
The monthly statistics below are based on closed sales. Since closing generally takes 30 days, the statistics for June are mostly reflective of sales in May. If you are interested in more information, every Monday Windermere Chief Economist Matthew Gardner provides an update regarding the impact of COVID-19 on the US economy and housing market. You can get Matthew’s latest update here.
EASTSIDE
KING COUNTY
SEATTLE
SNOHOMISH COUNTY
VIEW FULL SNOHOMISH COUNTY REPORT
This post originally appeared on GetTheWReport.com


